


NVIDIA Corporation (NVDA)
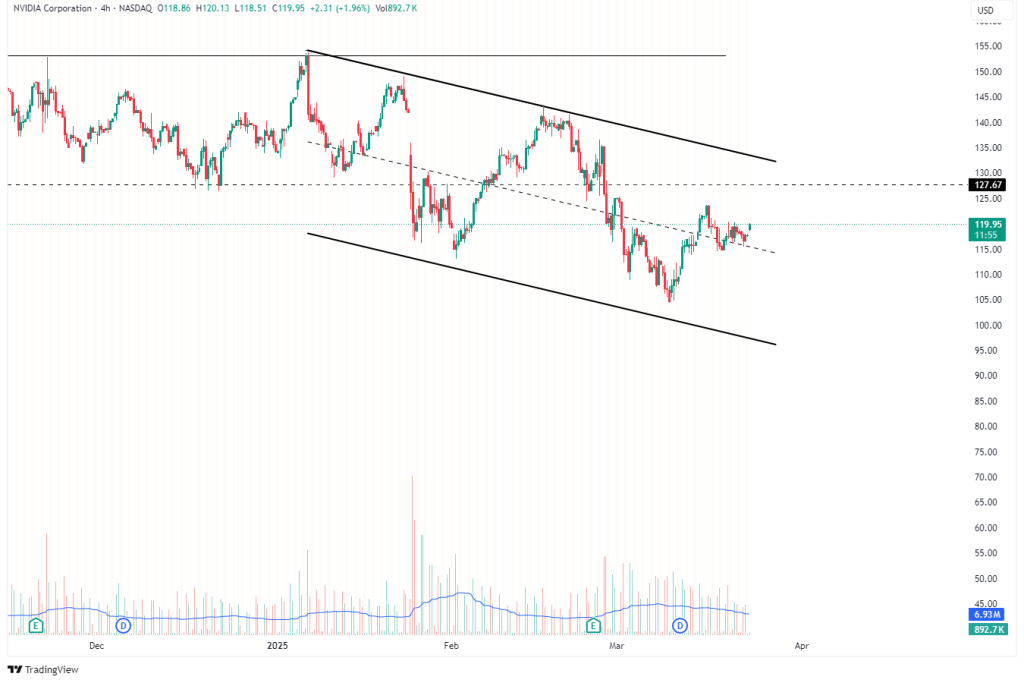
The chart reflects a clear descending channel formation. Price action has respected both the upper and lower boundaries of the channel since mid-January. Currently, the price is attempting a recovery from the lower bound and is trading around the midline of the channel.
- Key Resistance: $127.67 (also mid-channel resistance)
- Support Zone: ~$115.00
- Breakout potential only above the descending channel upper trendline.
Technical Techniques Used:
- Descending Channel
- Midline Support/Resistance
- Volume Analysis
Silver / U.S. Dollar (XAG/USD)
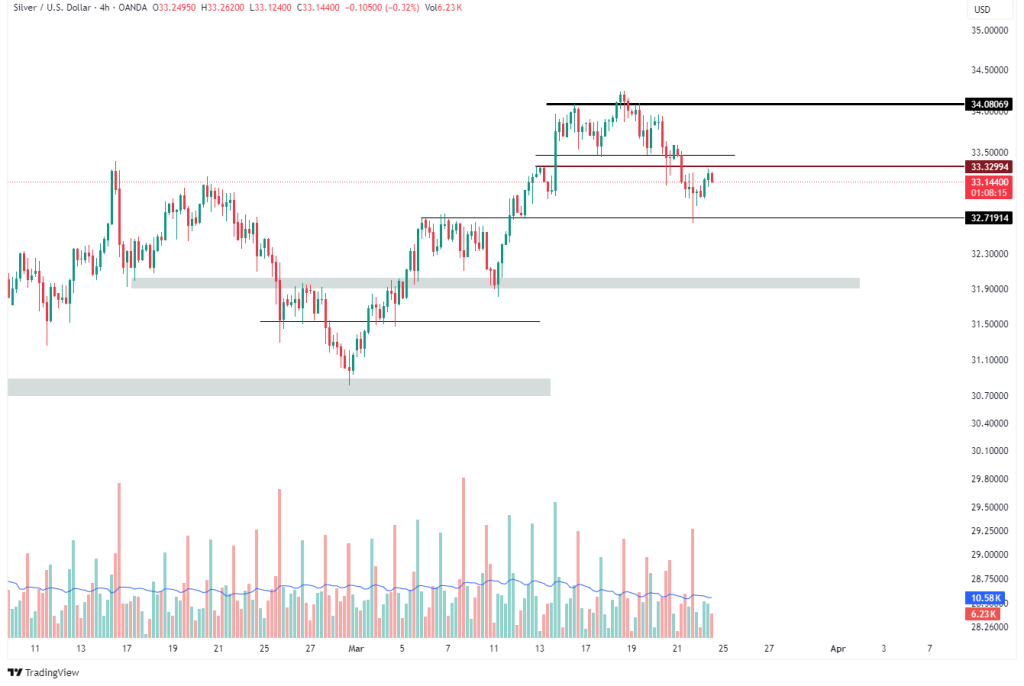
Silver is currently trading between a strong resistance zone around $34.08 and a support level of $32.72. The price recently bounced from the lower support and is now testing minor resistance at ~$33.32.
- Key Support: $32.72
- Resistance: $33.32 and $34.08
- Holding above $32.72 keeps bullish short-term bias intact.
Technical Techniques Used:
- Horizontal Support/Resistance
- Volume Profile
- Price Action Rejection Zones
Gold Spot / U.S. Dollar (XAU/USD)
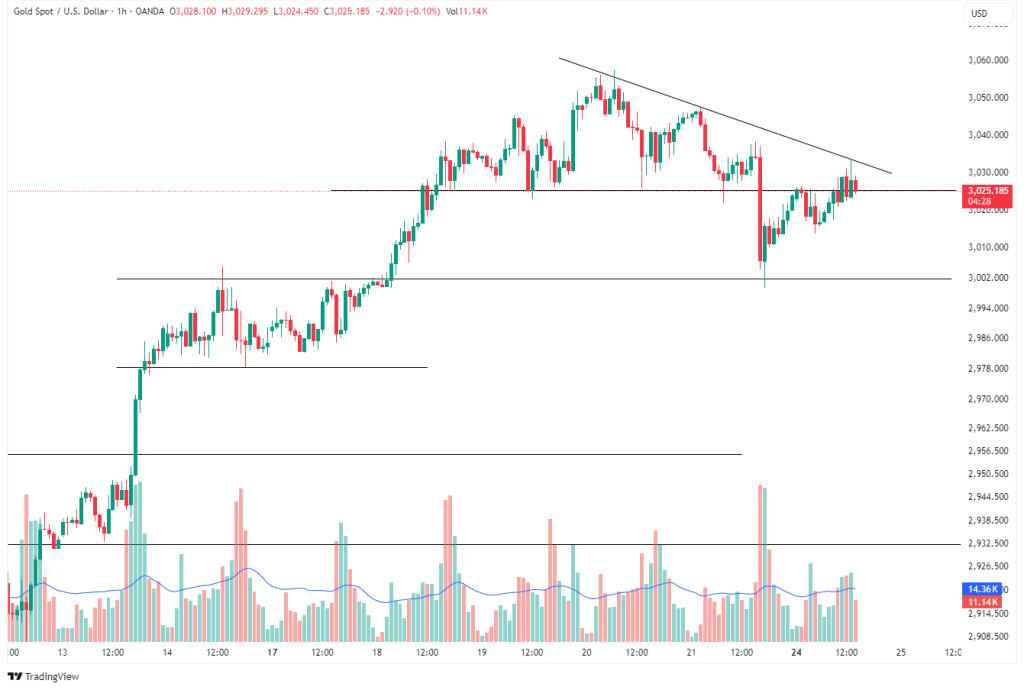
Gold is forming a symmetrical triangle pattern following a strong rally. Price is currently being compressed between a descending trendline and horizontal support near $3,020.
- Immediate Resistance: ~$3,040
- Immediate Support: ~$3,020
- Breakout direction will likely dictate short-term momentum.
Technical Techniques Used:
- Trendline Compression
- Support Zones
- Volume Confirmation
Brent Crude Oil
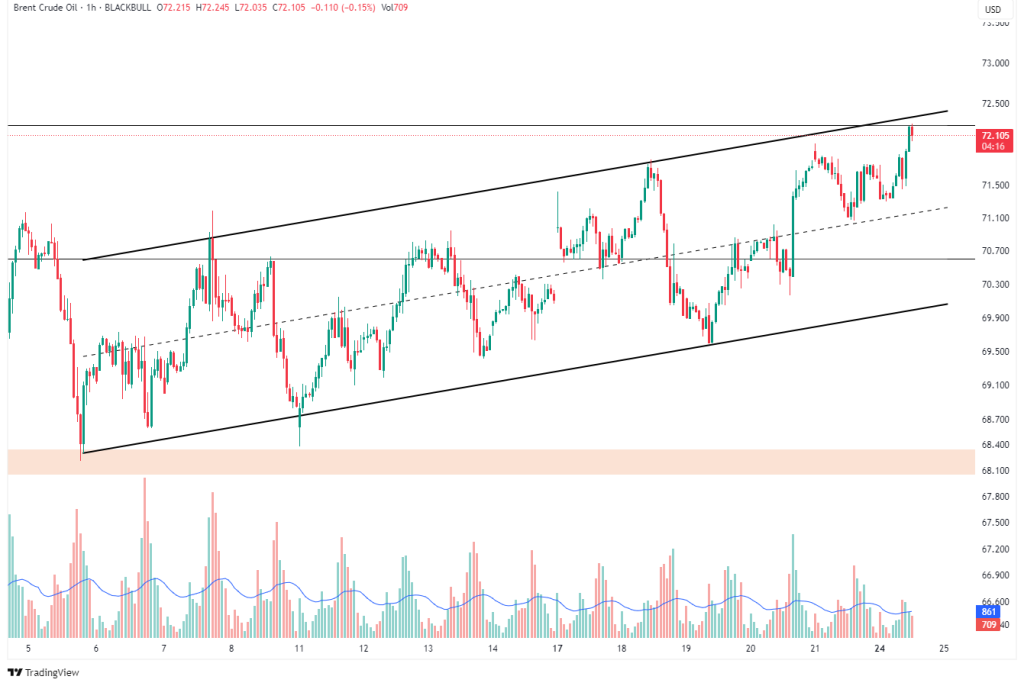
Brent is within an ascending channel with higher highs and higher lows. Price is now testing the upper boundary of the channel, showing potential resistance near $72.20.
- Support: ~$70.00
- Resistance: ~$72.50 (Channel top)
- Break above could signal bullish continuation, while rejection may imply a short-term pullback.
Technical Techniques Used:
- Ascending Channel
- Volume Trend
- Support/Resistance Trendlines


Leave A Comment