


GBPUSD Analysis
GBP/USD Rebounds Toward 1.2960 – Key Resistance Ahead
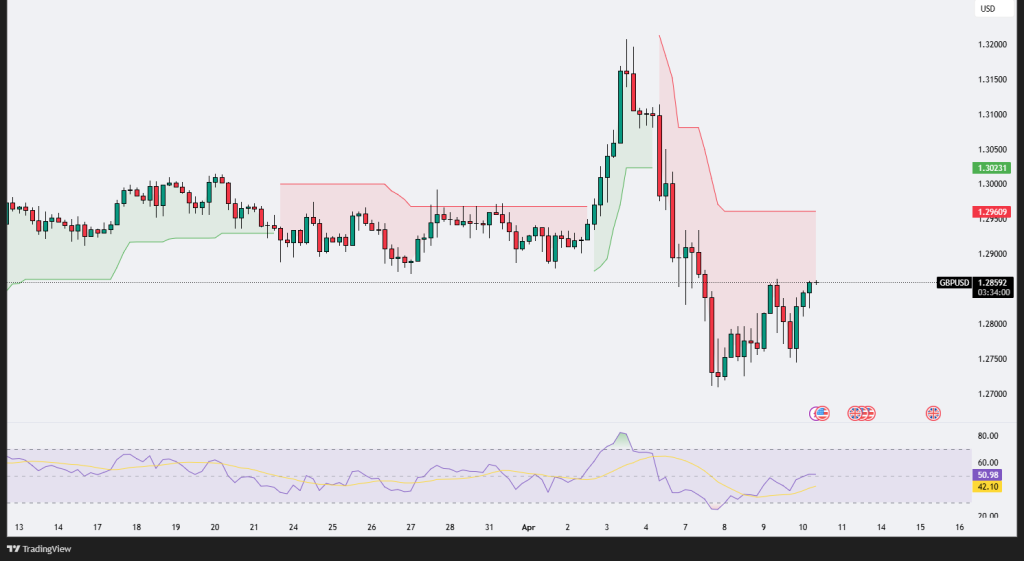
GBP/USD bounces from 1.27 and tests 1.2960 Kumo resistance. RSI above 50 signals modest momentum. Breakout needed to shift bias bullish.
GBP/USD has staged a strong rebound from the 1.2700 support zone, pushing into the red Kumo cloud acting as dynamic resistance near 1.2960. This level is now critical for determining whether the recovery becomes a bullish trend reversal or remains a temporary relief rally. The RSI has climbed above 50, indicating improving bullish momentum, though still limited. A confirmed breakout and close above 1.2960 would shift the short-term structure bullish; otherwise, the broader downtrend may resume.
EURUSD Analysis
EUR/USD Pulls Back to Cloud Resistance – Key Zone at 1.1000
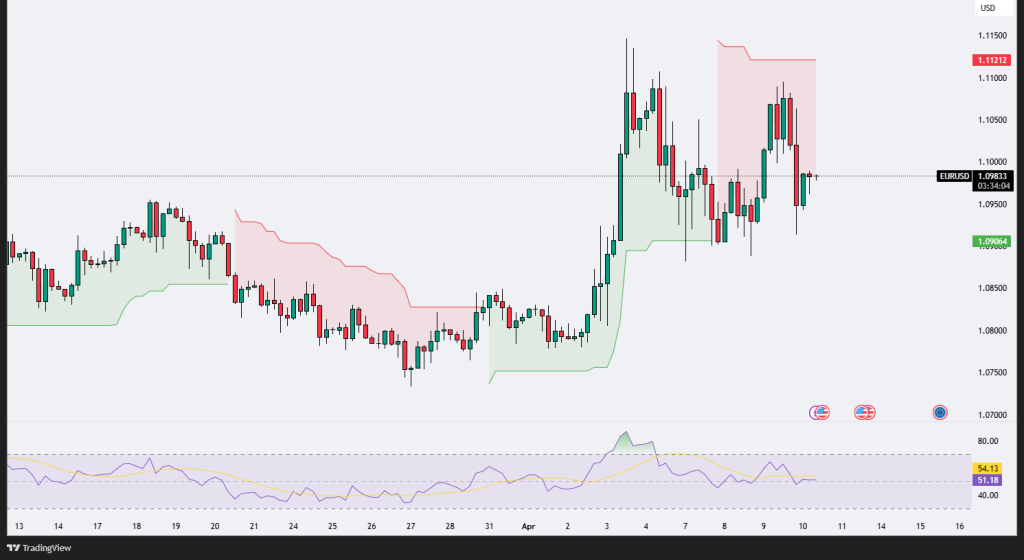
EUR/USD stalls near 1.0980–1.1000 cloud resistance. RSI in mid-50s shows indecision. Close above cloud may revive bullish momentum.
EUR/USD is showing signs of recovery, though price action remains consolidative after failing to hold above the 1.1100 breakout zone. The pair has now pulled back and is testing the lower edge of the red Kumo cloud, specifically the 1.0980–1.1000 region. This zone will be pivotal—a daily close above it could reignite bullish momentum, while continued rejection may lead to another drop toward the 1.0900 support level. The RSI hovers in the mid-50s, reflecting market indecision.
S&P 500 Futures Analysis
S&P 500 Futures Hit Resistance at 5,535 After V-Recovery
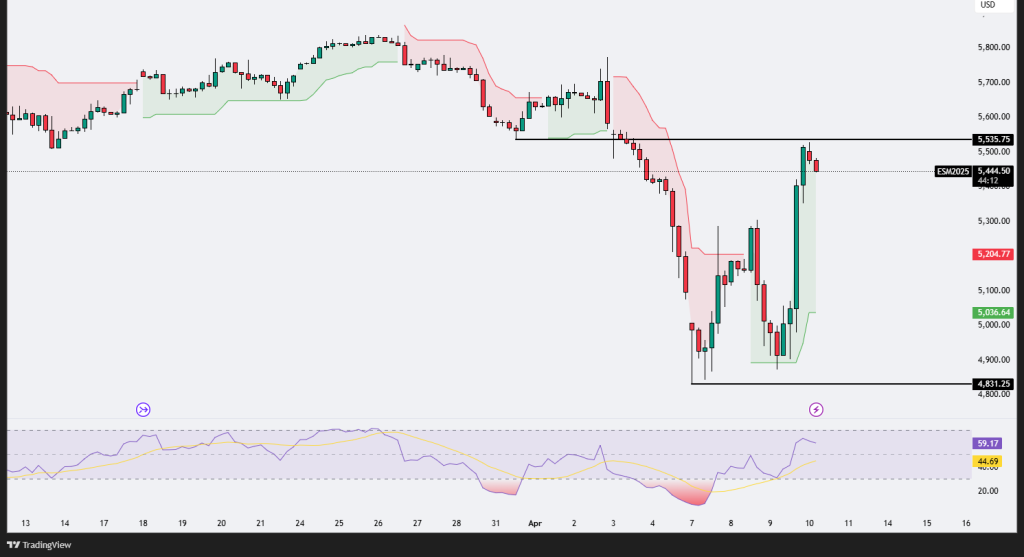
S&P 500 (ES) completes V-recovery from 4,831. RSI near 60 shows strength, but 5,535 rejection may trigger a correction to 5,200–5,036.
S&P 500 Futures (ES) have completed a textbook V-shaped recovery, bouncing strongly from the 4,831 support and reaching resistance at 5,535. Price was rejected on the first test, making this a critical zone for the next move. The RSI has climbed to nearly 60 but is starting to flatten, suggesting potential exhaustion. A confirmed break above 5,535 could signal a push toward all-time highs, while failure may lead to a pullback toward 5,200 or 5,036.
Nasdaq Futures Analysis
Nasdaq Futures Hover Below 19,000 – Can Momentum Hold?
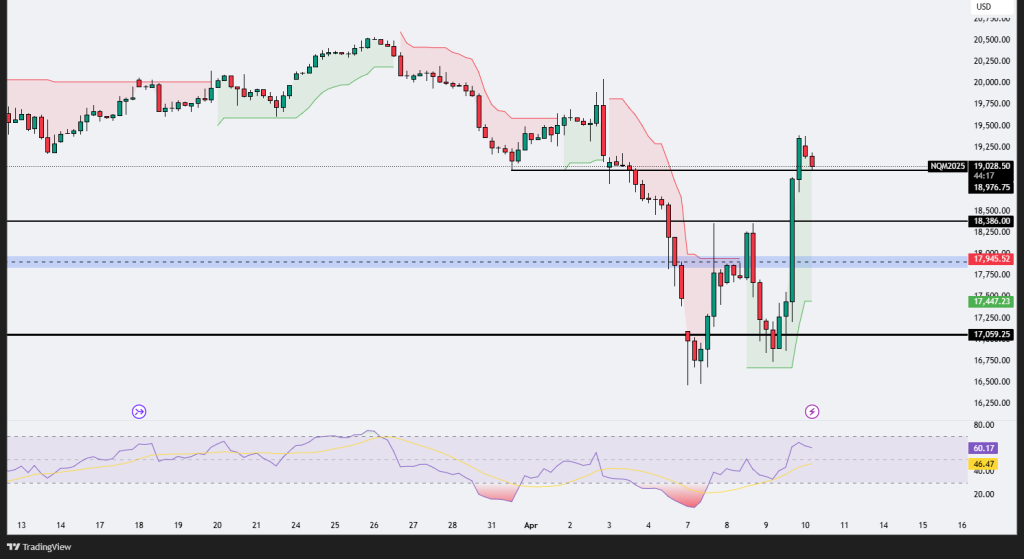
Nasdaq breaks past 18,200 with bullish RSI above 60. Holding above structure could target 19,500; below 18,380 may shift momentum.
Nasdaq Futures have staged a strong vertical rally, surpassing multiple resistance levels including the 17,945–18,200 zone, and now hover just below the 19,000 mark. The RSI has climbed above 60, reinforcing bullish momentum. If current structure holds, the next target sits at 19,500. However, a break back below 18,380 would invalidate the recent breakout and signal a potential shift in direction.


Leave A Comment