


USDJPY Analysis
USD/JPY Slips After 144.47 Test – Support at 141.63 in Focus
USD/JPY weakens after failing to hold 144.47. RSI drops to 47.24. Support at 141.63–141.95 now key to halting further downside pressure.
USD/JPY has pulled back after testing the 144.472 resistance zone, now trading near the 141.958–141.638 support band. After an aggressive selloff from 146.647, the pair attempted a mild recovery but is now losing bullish momentum. The cloud indicator has turned green but is narrowing, signaling a waning trend. Additionally, the RSI has dropped to 47.24 after peaking above 56, indicating fading buyer strength. If 141.938 support fails, a retest of lower levels could follow. A decisive rebound would be needed to restore bullish bias.

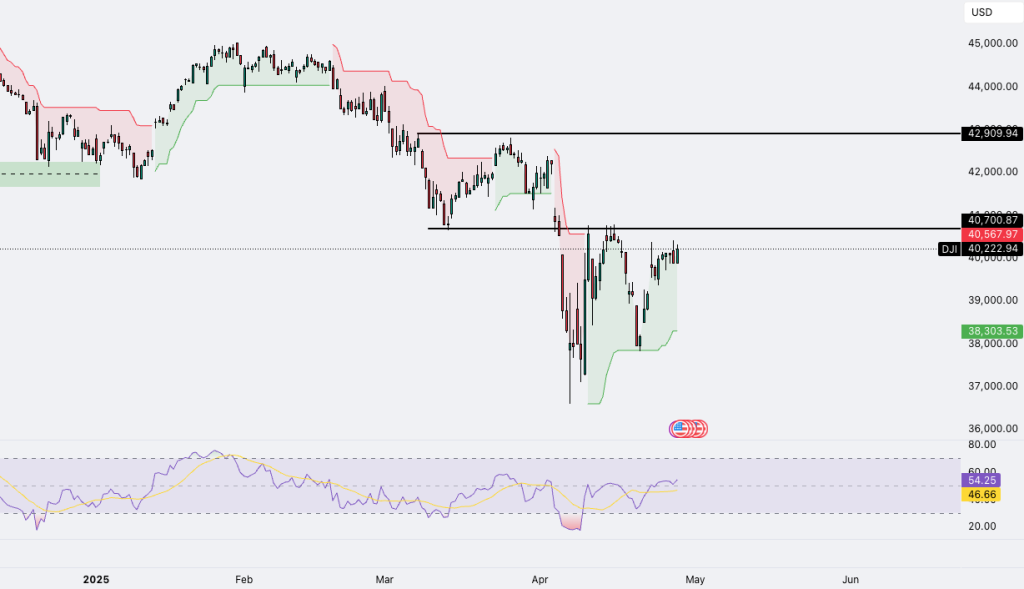
Dow Jones (DJI) Analysis
Dow Jones Tests 40,700 – Recovery Stalls Below Key Resistance
Dow Jones rebounds from 38,303 support but stalls below 40,700 resistance. RSI at 54.25 shows limited momentum. Breakout or pullback in focus.
The Dow Jones Industrial Average (DJI) is attempting to reclaim the key psychological level at 40,700, following a solid bounce off the 38,303.53 support zone. Price remains just beneath resistance, trading above the green trend cloud, which signals ongoing recovery momentum. However, the RSI sits at a neutral 54.25, only modestly above its moving average (46.66), suggesting lack of strong bullish conviction. A clean break above 40,700 is needed to confirm upside continuation, while failure to break out could lead to a pullback toward the 38,000 area.
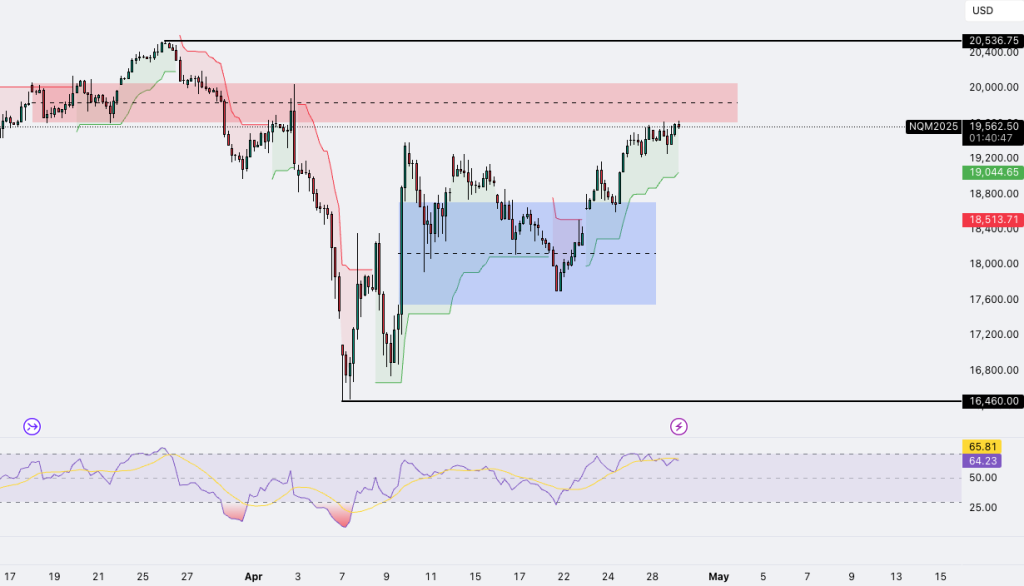
Nasdaq (NQ1!) Analysis
Nasdaq (NQ1!) Faces Heavy Resistance at 20,000 Zone
Nasdaq futures approach 19,500–20,000 resistance after sharp rally. RSI at 64.23 shows strong momentum, but risk of pullback is growing.
Nasdaq Futures (NQ1!) are testing a major supply zone between 19,500 and 20,000, where strong resistance is capping upward momentum. After a sharp rebound from 18,513.71 in mid-April, price continues to climb, supported by a consistently green trend cloud. The blue accumulation zone between 18,000 and 18,800 provided a solid base for this move. However, the RSI is now at 64.23, nearing the overbought threshold at 65.81, suggesting that buyers may soon face exhaustion. A consolidation or pullback could follow if the current resistance band holds.
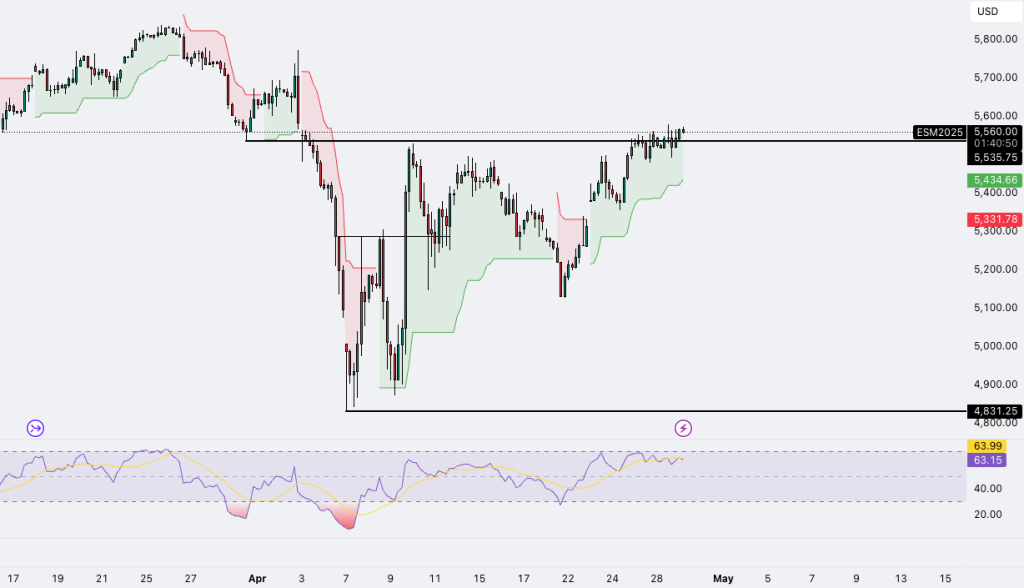
S&P 500 (ES1!) Analysis
S&P 500 (ES1!) Coils Below 5,560 – Breakout or Correction?
S&P 500 Futures consolidate near 5,560 resistance. RSI near 64 hints at overbought. A breakout may target new highs; failure risks 5,400–5,330 pullback.
S&P 500 Futures (ES1!) are pressing up against the 5,560 resistance level, closely mirroring the price structure seen in Nasdaq Futures. After a strong recovery from the 4,831.25 support zone, price transitioned cleanly into a bullish structure, confirmed by the green trend cloud. Currently, the index is consolidating tightly beneath resistance, with RSI ranging between 63.15 and 63.99, nearing the overbought threshold. This compression suggests a decisive move is near—a breakout above 5,560 could open the path to fresh all-time highs, while failure may lead to a correctiontoward the 5,400–5,330 zone.


Leave A Comment