


BRENT Analysis
Brent Crude Holds Below 68.70 – Bearish Trend Intact
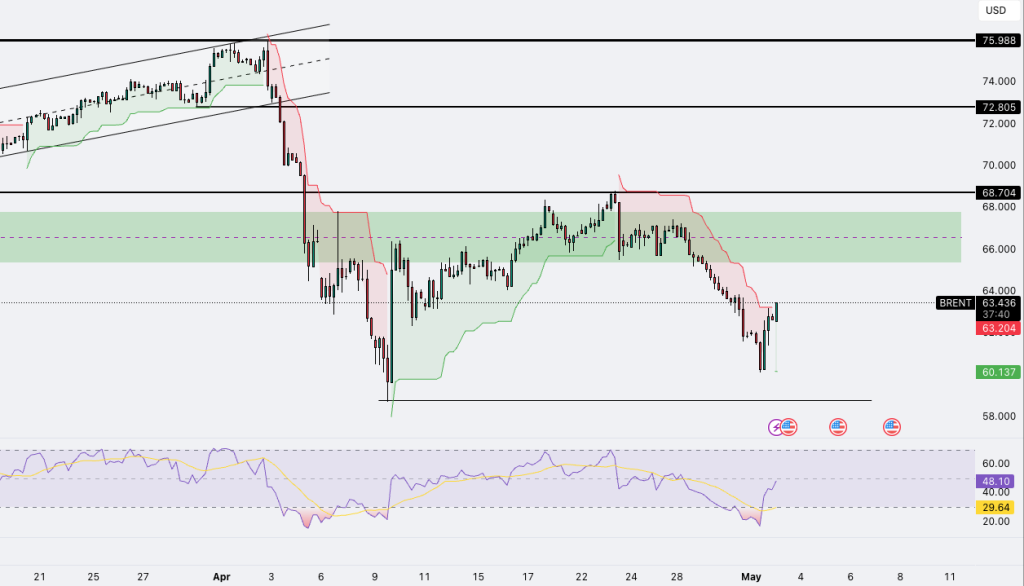
Brent crude remains under pressure below 68.70 resistance. RSI below 50 shows weak momentum. Bearish bias holds unless price reclaims key zone.
Brent crude oil continues to trade under bearish pressure, following a breakdown from the ascending channel and repeated failure to reclaim the 66.00–68.70 USD resistance block. After a bounce from the local low near 60.13 USD, price is now struggling against overhead resistance formed by the descending trend cloud and former demand zone. While the RSI has recovered from oversold levels, it remains below the 50 threshold, suggesting limited bullish conviction. As long as price remains below 68.70 USD, the bearish structure is intact, with downside risks toward the 60.00 region remaining in play.
USDJPY Analysis
USD/JPY Nears 149.40 – Overbought but Bullish Trend Holds
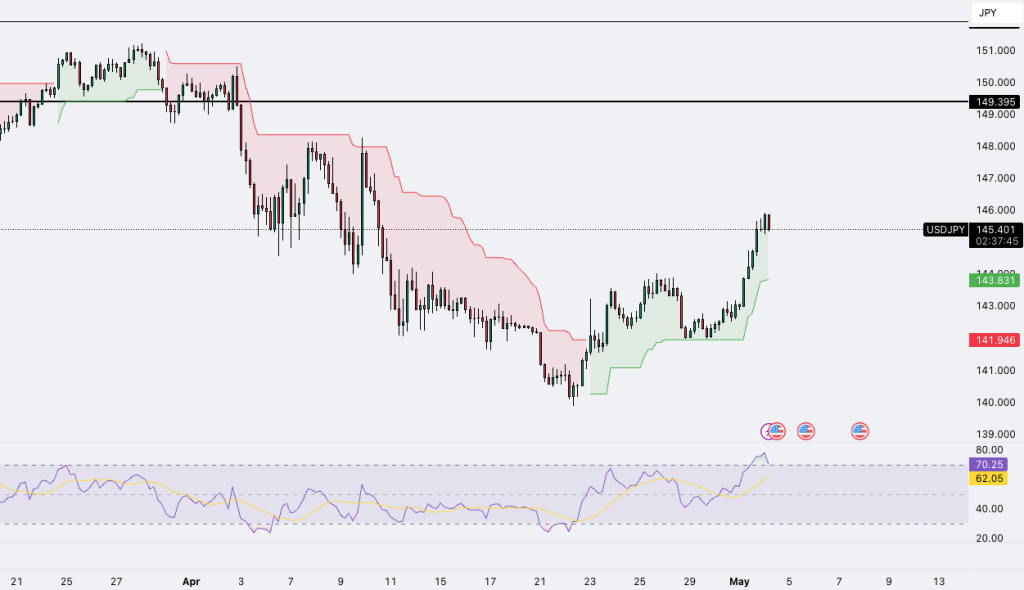
USD/JPY climbs above 145.00 with RSI over 70. Price eyes 149.395 resistance. Bullish trend intact unless 143.83 support breaks.
USD/JPY continues its bullish advance, now trading above 145.00 JPY, supported by a strong upward trend within the green Kumo cloud. The RSI is holding above 70, signaling overbought conditions, but confirming strong momentum. The pair is approaching a key horizontal resistance at 149.395, which marks the next major upside target. While some short-term exhaustion may emerge, the bullish structure remains intact unless 143.83 support is broken. Traders should monitor the 147.00–149.00 zone closely for potential divergence or reversal signals.
NASDAQ (NQ1!) Analysis
NASDAQ Futures Hover Below 20,000 – Breakout or Rejection?
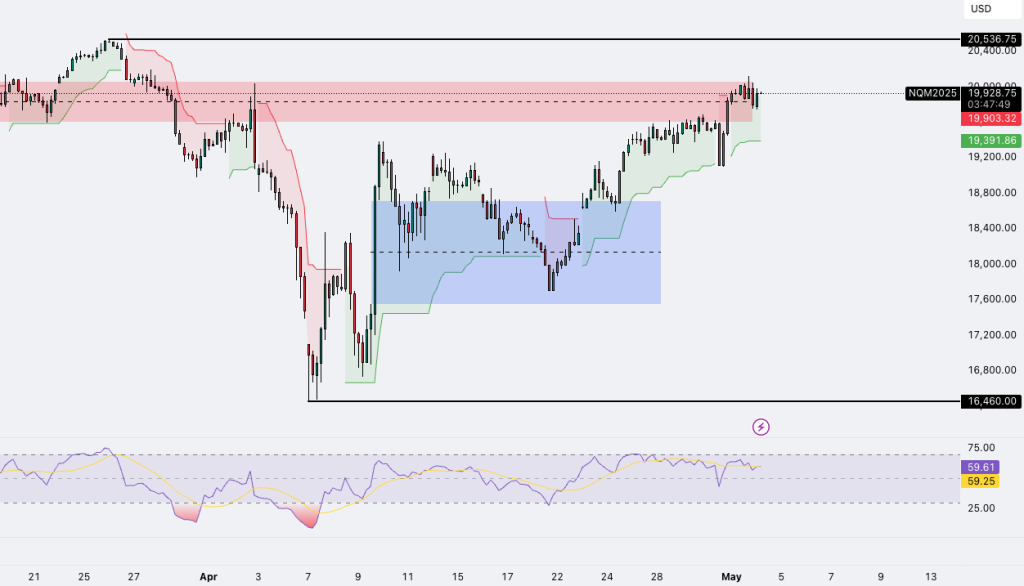
NASDAQ futures stall near 20,000 resistance. RSI flattens at 59, signaling hesitation. Breakout targets 20,536; failure may pull price toward 19,400.
NASDAQ Futures (NQ1! / NQM2025) are currently testing a key supply zone between 19,900 and 20,000, but have so far failed to achieve a decisive breakout above this critical red resistance block. The recent bullish move was fueled by a base-building phase within the blue consolidation zone, but momentum now appears to be slowing. The RSI is flattening around 59, reflecting growing indecision. A clean breakout above 20,000 is needed to extend the rally toward 20,536, while failure to hold above current levels could trigger a retracement toward 19,400.0.
S&P 500 (ES1!) Analysis
S&P 500 Hits 5,660 – Will Divergence Stall the Rally?
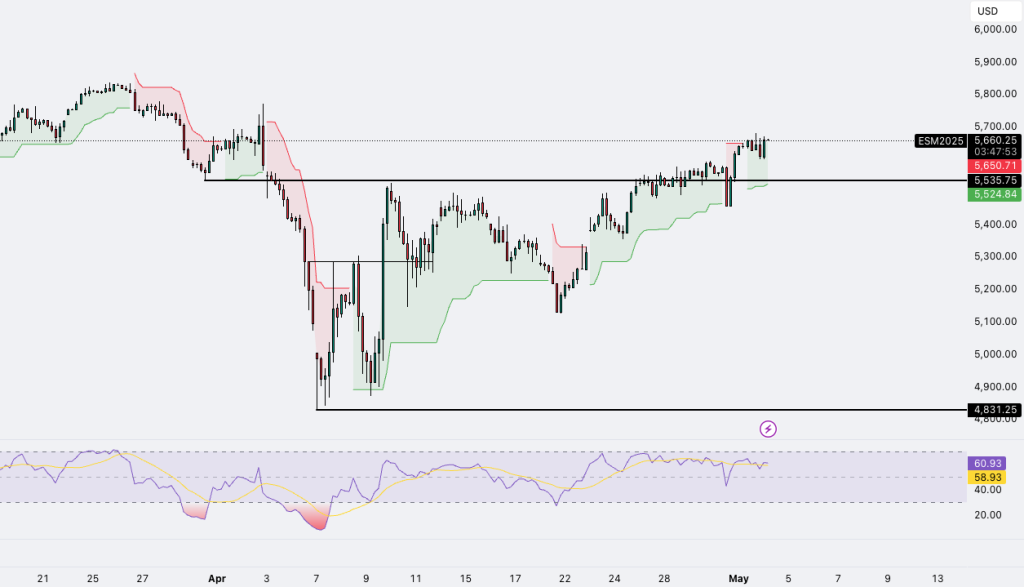
S&P 500 futures test 5,660 resistance with RSI divergence forming. Holding above 5,535 is key; breakout above 5,700 confirms bullish continuation.
S&P 500 Futures (ES1! / ESM2025) have reached a major resistance level at 5,660 following an extended bullish move from the April lows. Price action remains above the supportive trend cloud, reflecting an intact bullish structure. However, the RSI is showing bearish divergence, as momentum weakens despite new price highs—a potential early warning of exhaustion. The 5,535 level, which marked the previous range high, now acts as critical support. A close below this zone may initiate a correction, while a break and hold above 5,700 would confirm a resumption of the uptrend.


Leave A Comment