


🚨 Brent Crude Oil (BRENT)
Brent Hits $68 Wall – Will Bulls Burn Out or Break Through?
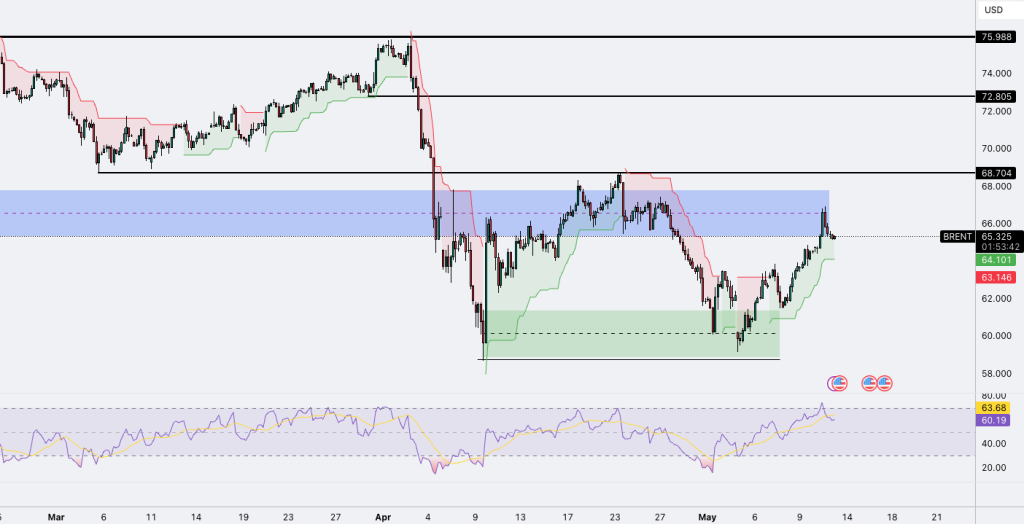
Brent hits resistance at $66–$68 and pulls back from overbought RSI. Breakdown below $64.10 could retest $61–$60; bulls need $68.70 reclaim.
Brent crude oil rallied from the key demand zone near $60 and reached the previously rejected supply area between $66 and $68, forming a strong resistance zone. The latest candle shows rejection from this level, while RSI pulls back from the 70 level, signaling overbought conditions and the potential for a short-term correction. If price confirms a breakdown below $64.10, a retest of the $61–$60 zone becomes more likely. On the upside, reclaiming $68.70 would be necessary to shift the medium-term trend back in favor of the bulls. The shaded zones and Ichimoku cloud represent dynamic support, resistance, and fair value gaps.
🚀 S&P 500 E-mini Futures (ESM2025)
S&P 500 E-Minis Hover Near Highs – Pullback or Launch?
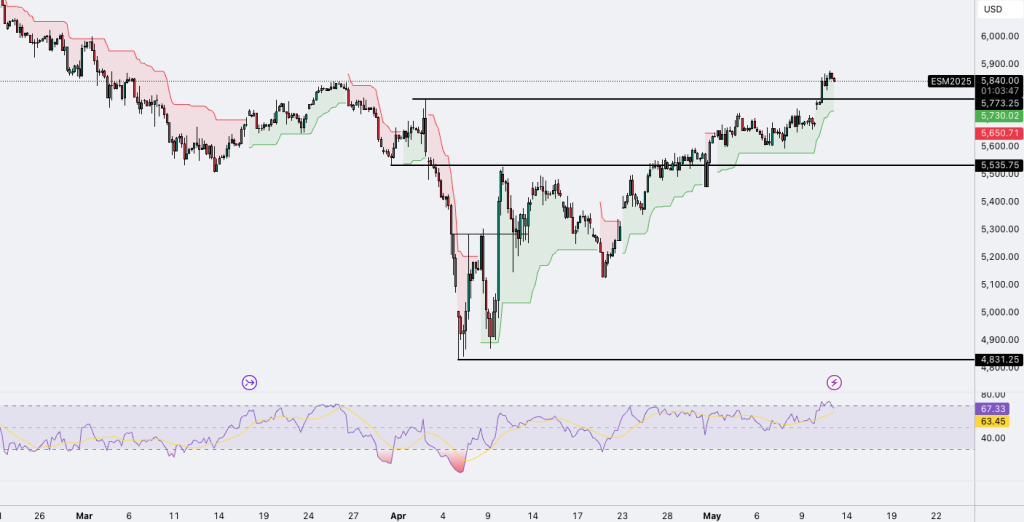
ESM2025 holds above $5,773 and tests $5,840. RSI stays bullish above 60; watch $5,730–$5,650 for potential dip-buy zone if trend holds.
S&P 500 E-mini Futures (ESM2025) maintain a strong bullish structure, with price breaking above the $5,773 resistance zone and consolidating just below $5,840. The green dynamic support highlights ongoing upward momentum and potential for trend continuation. RSI remains in bullish territory above 60 but is starting to curl downward, indicating possible short-term exhaustion. A pullback toward the $5,730–$5,650 area could present a buying opportunity, as long as price stays above the former resistance-turned-support at $5,535.
💹 USD/JPY
USD/JPY Breaks Out – Overbought RSI Hints at Pullback
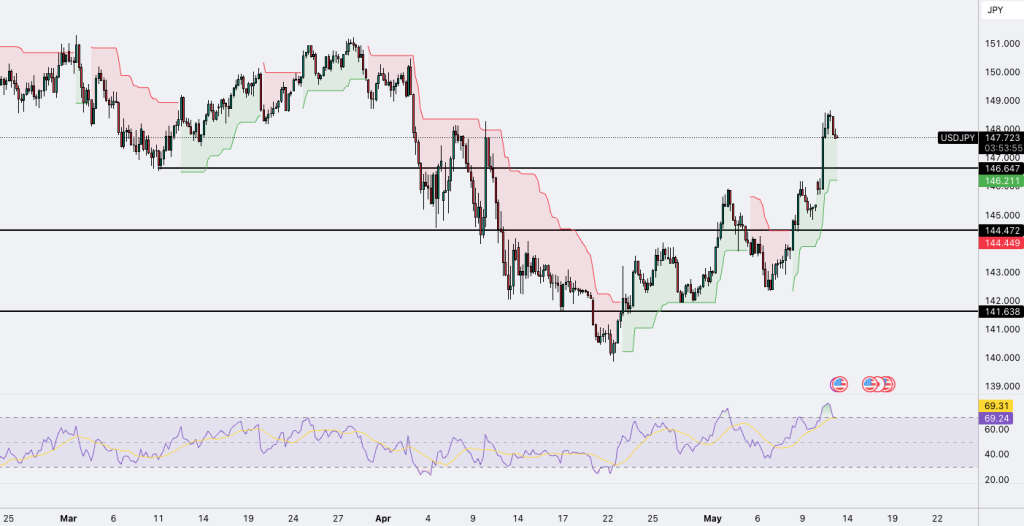
USD/JPY clears 147.00 resistance and holds above 147.70. RSI diverges from overbought zone; 146.20 is key for trend continuation or reversal.
USD/JPY surged past the 146.20–147.00 resistance zone and is now holding above 147.70, confirming bullish momentum. RSI has entered overbought territory but is now diverging downward, signaling a potential short-term pullback. Despite this, the green Ichimoku-like dynamic support band maintains the overall bullish structure. A healthy retracement toward 146.20 could support continuation. However, a daily close below 146.20 would invalidate near-term bullishness and open the way toward 144.50.
📊 NASDAQ 100 E-mini Futures (NQM2025)
Nasdaq Futures Break Out – Can Bulls Keep the Momentum?
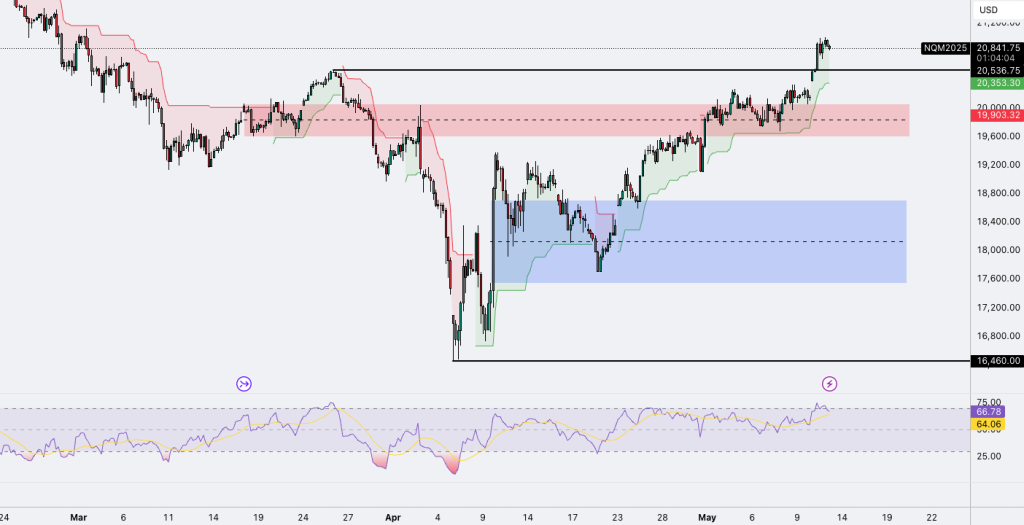
Nasdaq clears $20,353 and trades above $20,800. RSI above 65 supports bullish momentum, but watch for divergence. Key support: $20,350.
Nasdaq 100 E-mini Futures (NQM2025) broke out of the $20,353 resistance and are now trading above $20,800, exiting a multi-week consolidation phase. The move cleared a major supply zone around $20,000, confirming bullish strength. RSI is trending above 65, indicating sustained momentum. However, as with other assets, a potential bearish divergence may emerge, suggesting a short-term pause. As long as price holds above $20,350, the bullish continuation remains intact with new highs in sight. A drop below that level could prompt a retest of the $19,900 demand zone.


Leave A Comment