


This weekly technical analysis highlights crucial price movements across four major assets — Bitcoin (BTCUSDT), USD/JPY, WTI Crude Oil, and Silver. The charts reflect key support and resistance zones, with notable setups suggesting potential breakouts or retracements.
Weekly Technical Analysis: Bitcoin (BTCUSDT) Rebounds from Key Support
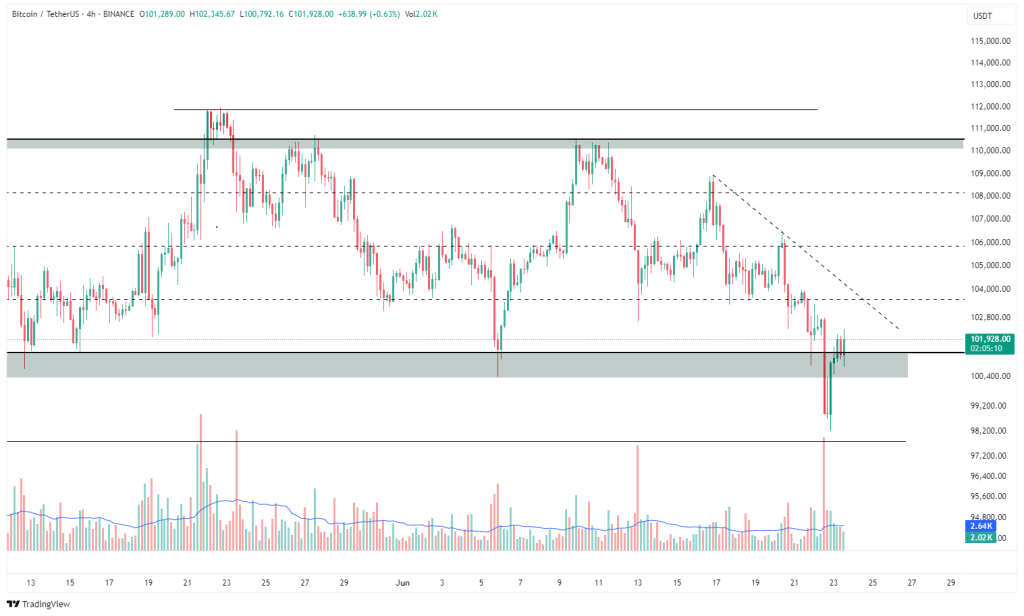
The chart shows a clear rebound from the significant demand zone around 100,000 USDT. This area has historically served as strong support, evidenced by the sharp bullish reaction. The price has now reclaimed the 101,000 level and is testing the descending trendline resistance formed over the past two weeks. If this trendline breaks, a move toward the 104,000–106,000 range could be expected. However, failure to hold above the 101,000 area might lead to renewed selling pressure.
- Key Support: 99,500–100,500
- Key Resistance: 104,000 / 106,500
USDJPY Faces Resistance in Weekly Technical Analysis Outlook
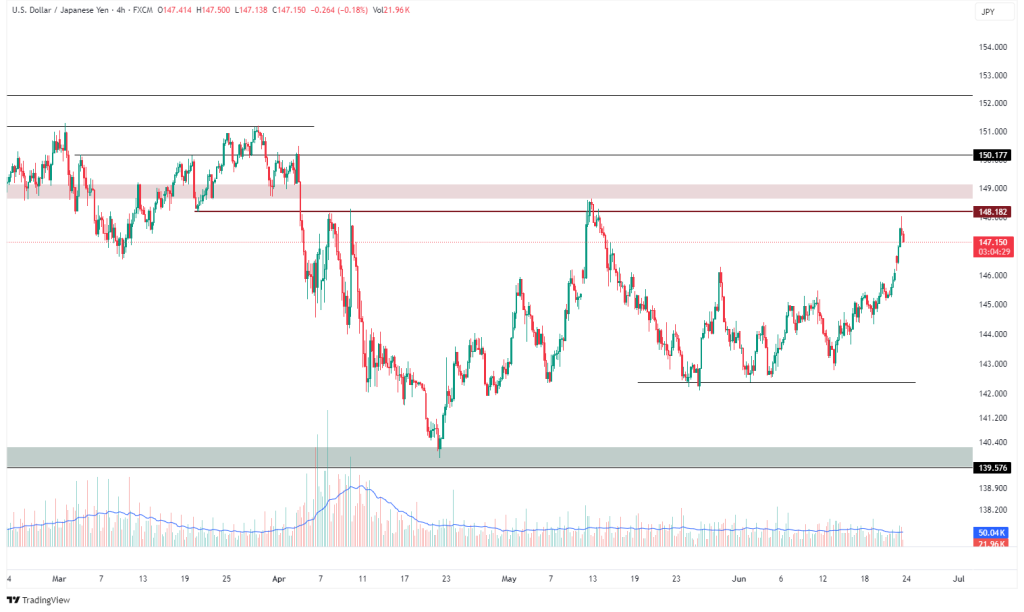
USDJPY has approached a key supply zone between 148.00–149.00, which previously triggered sharp sell-offs. Price has shown signs of rejection from this resistance, suggesting potential downside risk in the short term. If bears push the price lower, a drop back toward 145.00 and possibly 143.00 may unfold. A break above 149.00 would, however, indicate strength, targeting 150.17 and higher.
- Key Resistance: 148.00–149.00 (supply zone)
- Key Support: 145.00 / 143.00
WTI Crude Oil Tests Channel Resistance Near $75
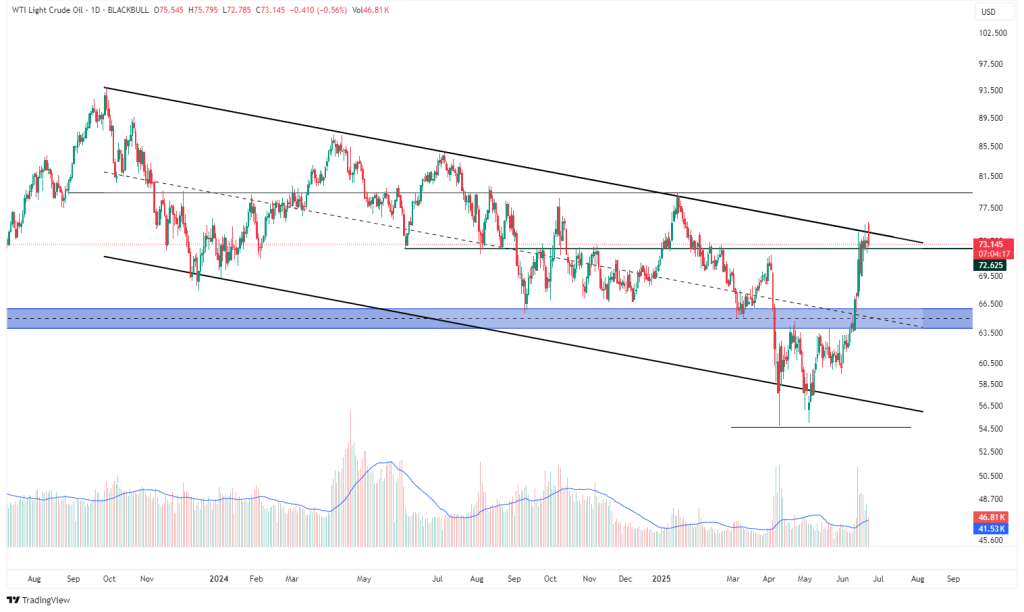
WTI is testing the upper boundary of a long-term descending channel after a sharp rally from the demand zone between 63.00–67.00. The 73.00–75.00 region is a major resistance cluster, aligning with the upper trendline of the channel. Price action near this level is critical — a breakout could mark a reversal in the broader downtrend, while rejection may trigger a retracement toward the mid-channel support.
- Key Resistance: 75.00 (channel top)
- Key Support: 67.00 / 63.00 (zone)
Silver Holds Breakout Structure Above $34.80
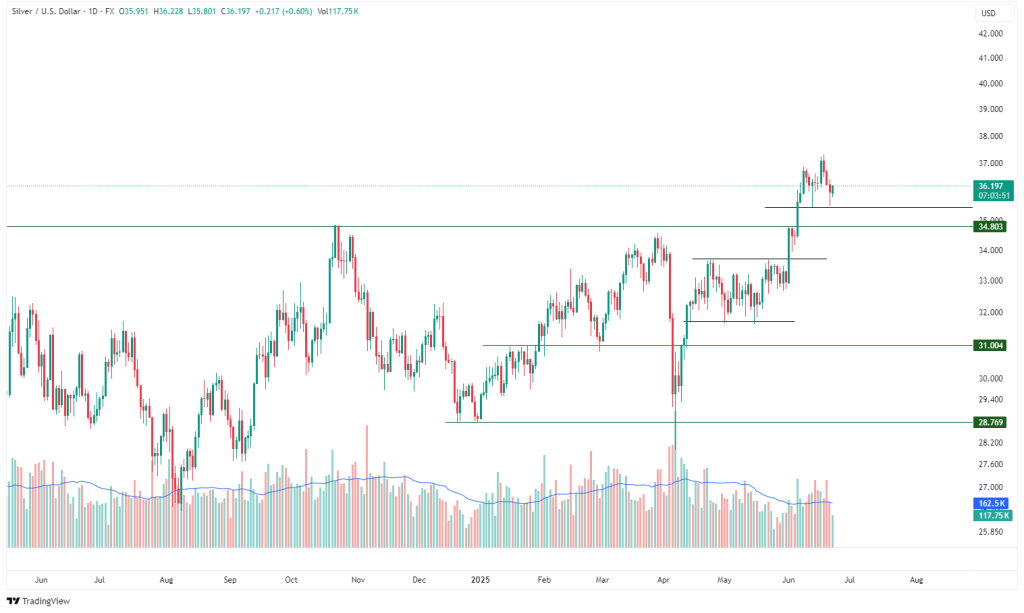
Silver remains in a bullish structure following a breakout above the long-standing resistance at 34.80. Currently, the price is consolidating just above this breakout level, which now acts as support. As long as 34.80 holds, bulls may aim for new highs above 36.50. A drop below this level, however, would signal a failed breakout and could lead to a deeper correction toward 31.00.
- Key Support: 34.80 / 31.00
- Key Resistance: 36.50+


Leave A Comment