


In today’s daily market technical analysis, we examine key moves across major assets including GBP/USD, Brent Crude Oil, NASDAQ, and Nikkei. Price action across these instruments reflects shifting risk sentiment and momentum patterns that traders are closely watching. From potential breakouts to rejection zones, this technical snapshot outlines the critical support and resistance levels shaping the market outlook.
GBP/USD Approaches Breakout Zone in Today’s Daily Market Technical Analysis:
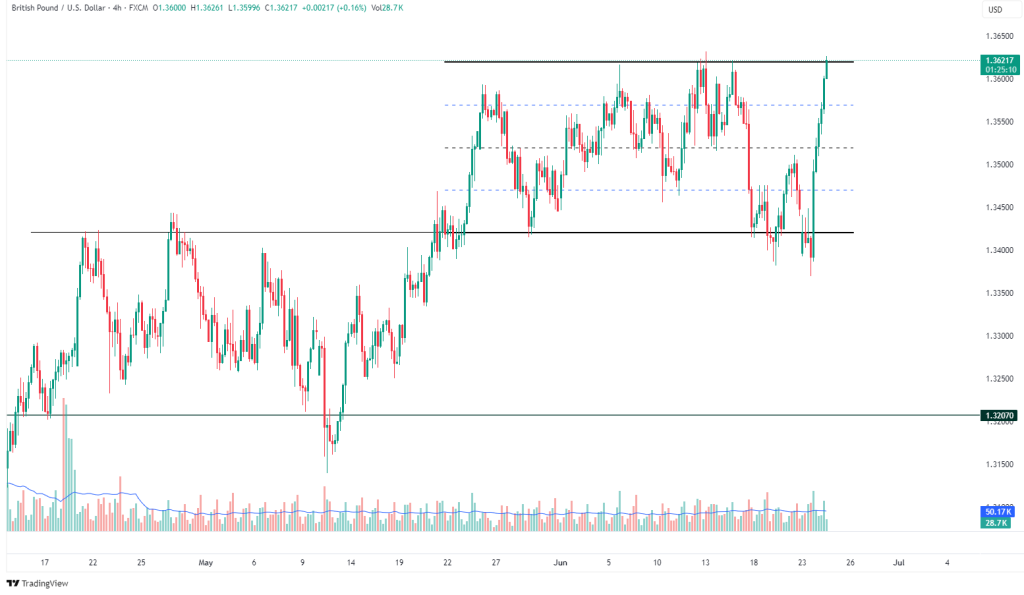
GBP/USD is currently testing the upper boundary of a horizontal range that has held since late May, between approximately 1.3420 and 1.3620. The price recently surged from the lower bound, sharply rejecting support and reclaiming all mid-range levels with strong momentum.
- Key Levels: Resistance at 1.3620, support at 1.3420
- Technical Outlook: A clean breakout above 1.3620 could invite continuation toward higher highs. Failing to break may bring a return into the range.
Daily Market Technical Analysis: Brent Crude Rejects Key Resistance
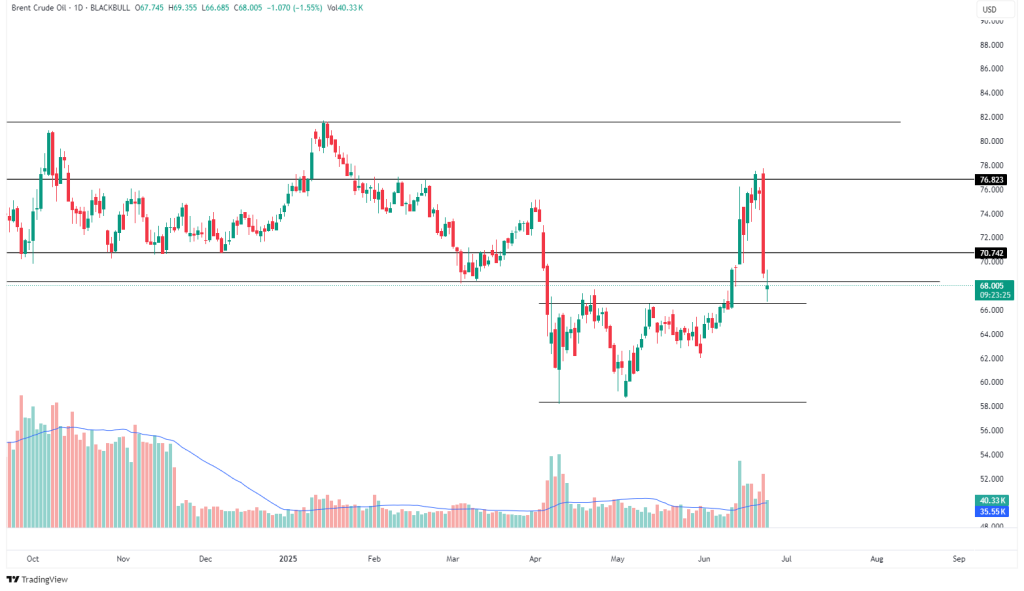
Brent price sharply rejected resistance at 76.82 after a strong rally and is now testing previous consolidation levels around 68–70. Volume spiked near resistance, hinting at strong seller interest.
- Key Levels: Resistance at 76.82, support around 66.5–67
- Technical Outlook: Failure to hold above the midpoint zone (70.74) may lead to deeper retracements. Otherwise, a bounce could suggest range continuation.
NASDAQ Breaks Above 21,982 With Volume Surge, Momentum Builds
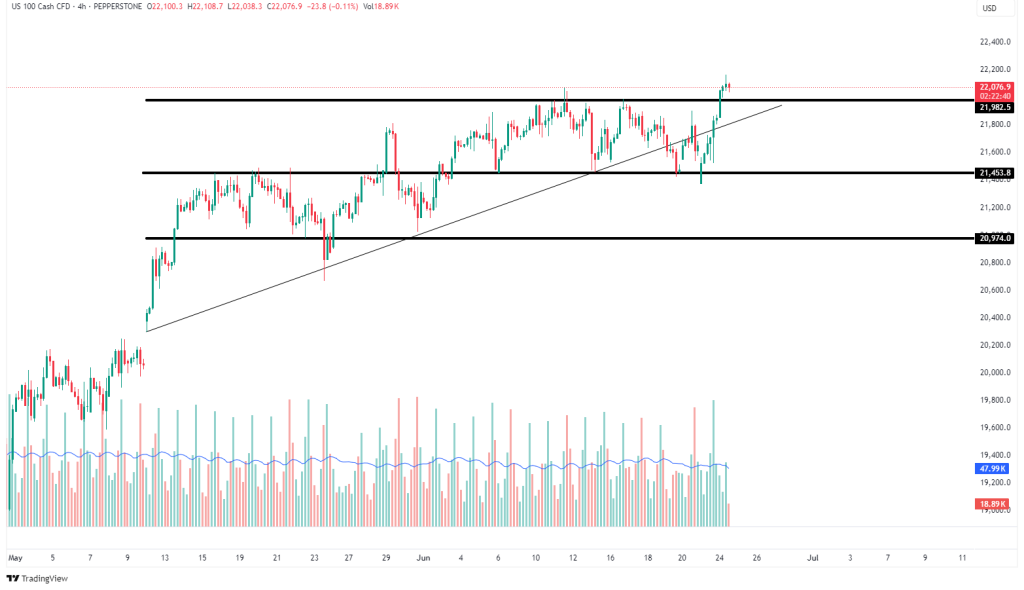
NASDAQ shows a breakout above the 21,982 resistance after consolidating within a rising triangle formation. Volume increased during the move, suggesting buyer commitment.
- Key Levels: Support turned resistance at 21,982, next support 21,453
- Technical Outlook: Sustained holds above 21,982 could trigger a new leg upward. A failed retest would bring the prior range back into play.
Nikkei Consolidates Below 38,900 as Rising Wedge Tightens
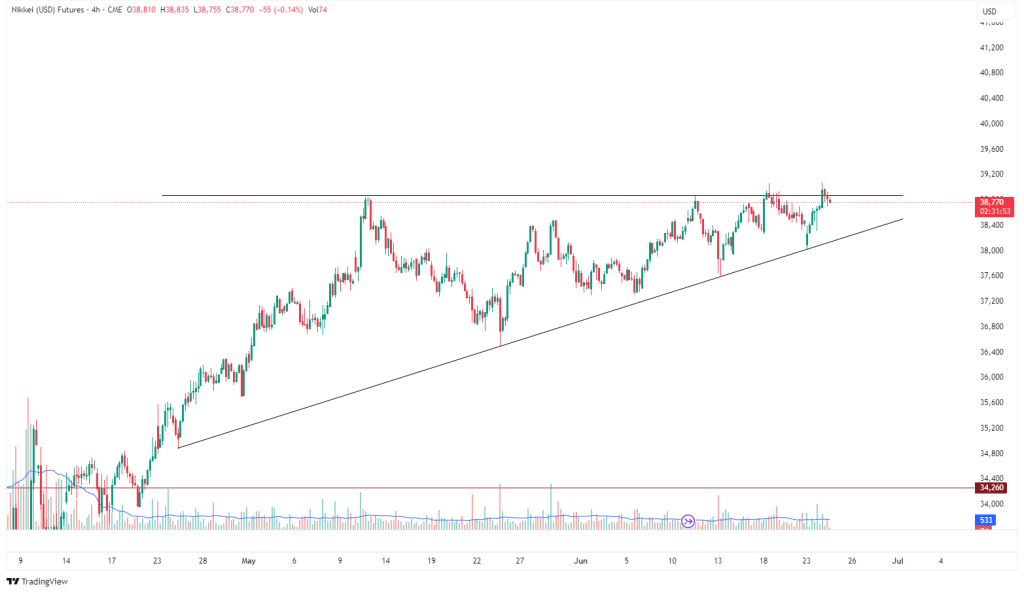
Nikkei remains within a rising wedge formation. Price is consolidating near the top resistance around 38,900, having failed multiple times to break convincingly.
- Key Levels: Resistance at 38,900, rising support trendline near 38,000
- Technical Outlook: Watch for breakout confirmation or rejection to determine whether momentum continues or reverses. Breakdown from the wedge could imply short-term weakness.


Leave A Comment