


In today’s EURUSD, Ethereum, Copper, and Nasdaq technical analysis, markets show a mix of breakout confirmations, compression patterns, and early warning signals. EURUSD has cleared key resistance and is now retesting the breakout zone, while Ethereum consolidates within a symmetrical triangle near a major trendline. Meanwhile, Copper has staged a bullish recovery after breaking its descending structure, and Nasdaq futures are flashing caution with bearish divergence inside a rising wedge. This analysis dives into the technical outlook across asset classes as volatility brews beneath the surface.
EURUSD Ethereum Copper Nasdaq Technical Analysis: EURUSD Breakout Holds
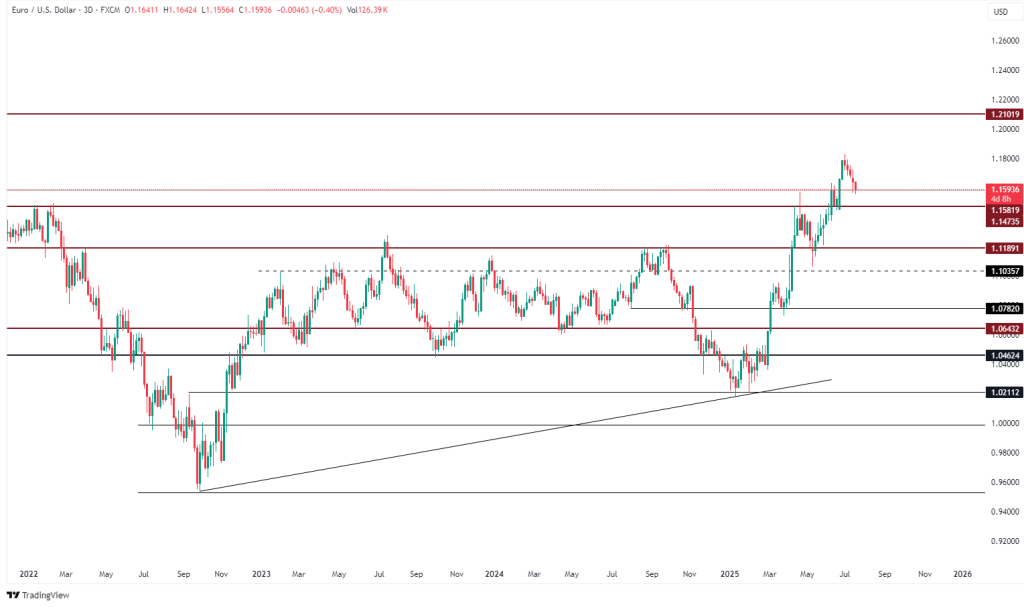
- Breakout Confirmation: EURUSD has broken above horizontal resistance (~1.090), now retesting it.
- Bull Flag: Consolidation resembles a flag formation — a continuation pattern.
- MACD/RSI: RSI is supportive (above 50), MACD histogram turning positive.
- Bias: Bullish. If retest holds, next target around 1.115–1.12 zone.
Ethereum Triangle Forming Ahead of Breakout Decision
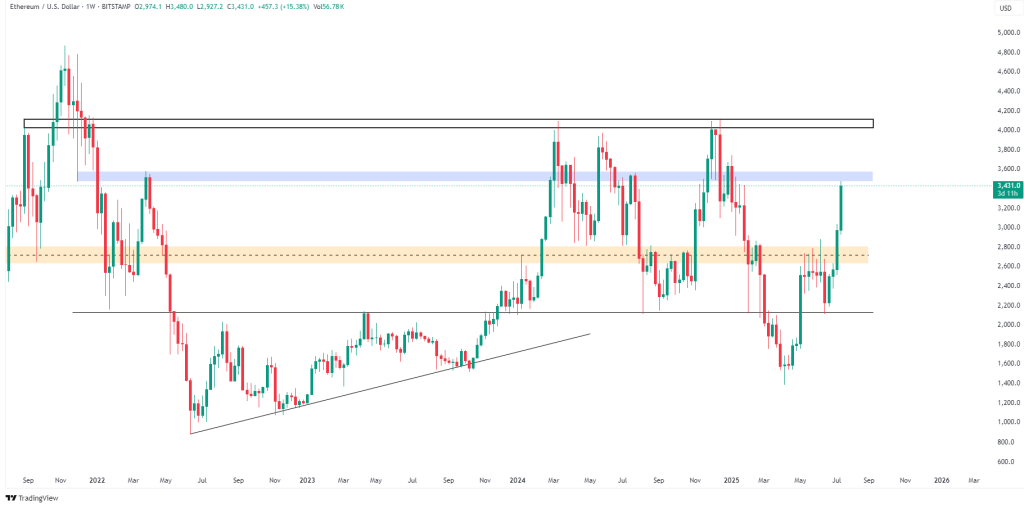
- Trendline Support Test: Ethereum price is currently respecting a long-term ascending trendline.
- Structure: Symmetrical triangle formation nearing apex. A breakout is imminent.
- RSI & Momentum: RSI is neutral (around 50), indicating indecision. Volume has been contracting, consistent with the triangle pattern.
- Bias: Neutral-to-bullish; watch for breakout above resistance (~3150 USD) to confirm bullish continuation. Breakdown below support (~2900 USD) could trigger sell-off.
Copper Eyes $4.80 After Bullish Breakout Retest
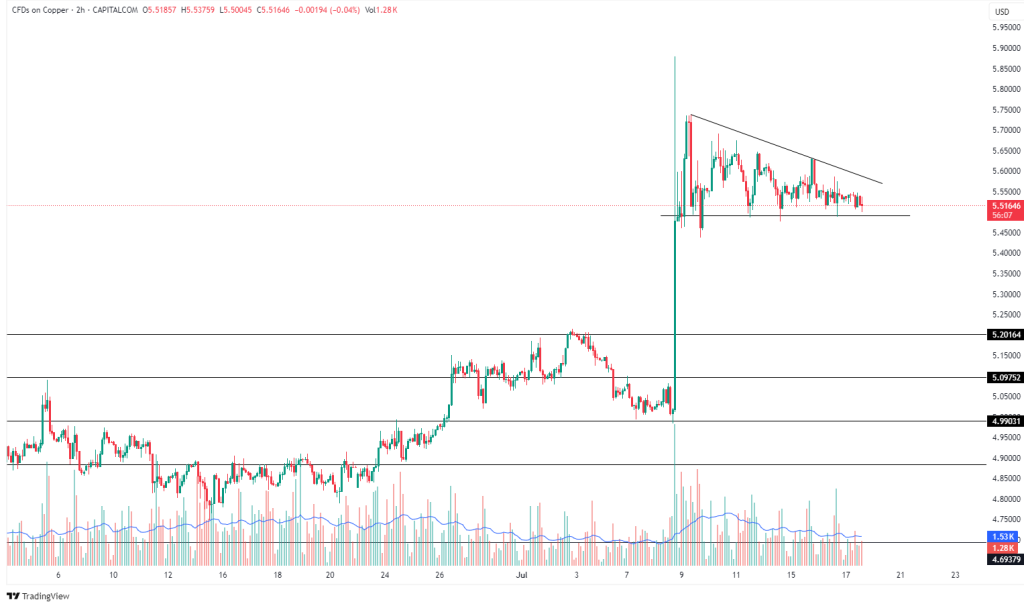
- Descending Channel Breakout: Copper appears to have broken out of a falling wedge or descending channel.
- Backtest Phase: Price is backtesting the breakout level — a healthy retest pattern before potential continuation.
- RSI: Trending upward from oversold area; positive momentum building.
- Bias: Bullish. If price holds above 4.5 level, potential for sharp move toward 4.8–5.0 range.
Nasdaq Futures Show Bearish Divergence at Wedge Top
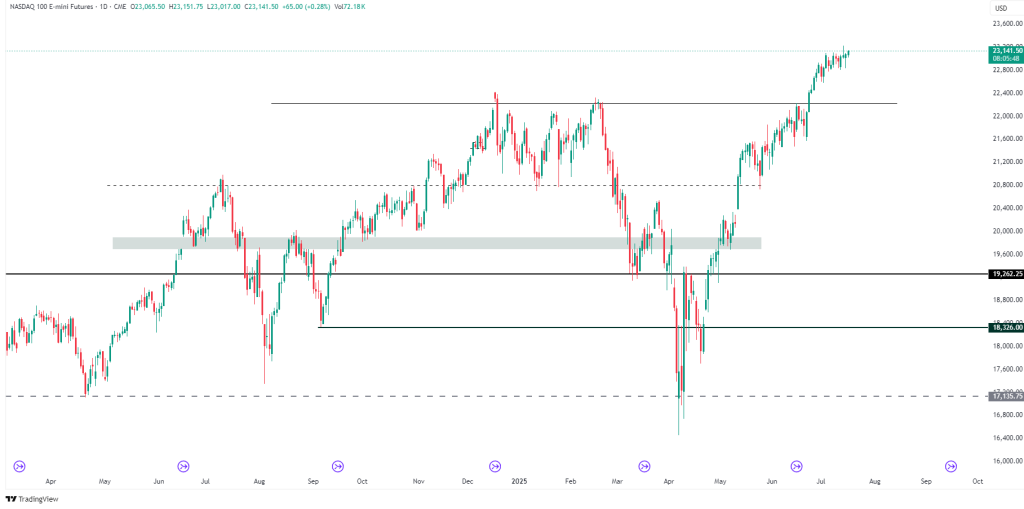
- Rising Wedge / Parabolic Trend: The chart shows a potential rising wedge, which often signals trend exhaustion.
- Bearish Divergence: RSI is showing clear bearish divergence while price makes new highs.
- Warning Signal: Price near upper wedge resistance; caution advised.
- Bias: Bearish-to-neutral. A break below lower wedge support could lead to correction toward 19500–19000 range.


Leave A Comment