


This technical analysis examines Silver, Dow Jones, GBP/USD, and Bitcoin, focusing on key price levels and patterns shaping short‑term market direction. Traders should monitor resistance re‑tests, trendline breaks, and momentum shifts to identify potential breakout or correction setups.
Silver Technical Analysis – Key Levels and Momentum Shift
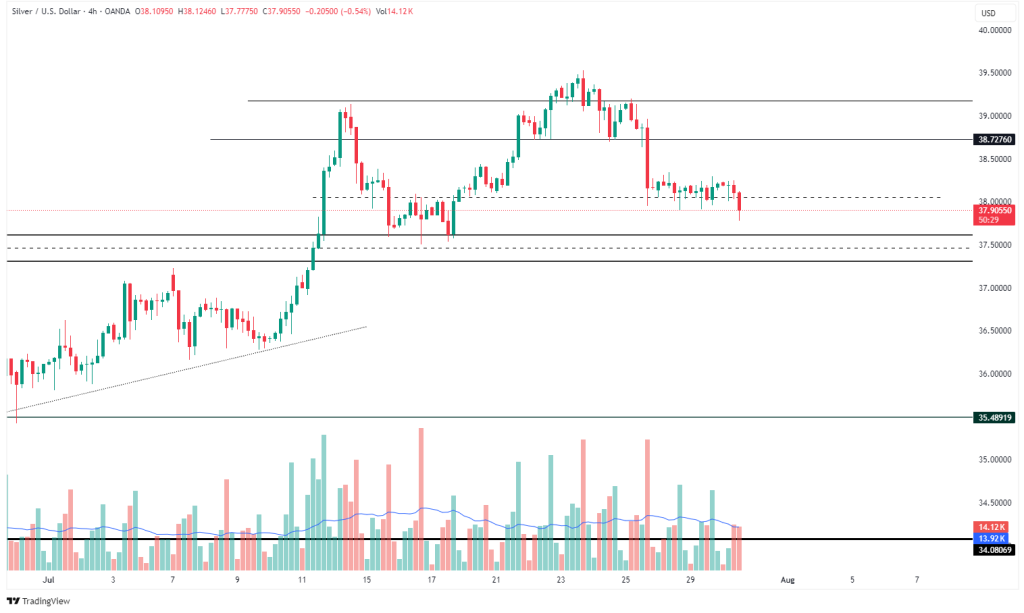
Silver’s recent 4H chart shows a clear shift in momentum. After peaking near the $39.50 region, price has repeatedly tested the $38.77 resistance but failed to hold above. The volume profile reveals diminishing buy interest, suggesting a weakening bull grip. Currently, price is hovering slightly below $38, sitting just atop the key mid-support at $37.90.
Should this level break decisively with increased volume, the next support sits around $37.50. Conversely, reclaiming $38.77 with strong bullish candles could re-open the path toward the previous high zone.
Dow Jones Technical Analysis – Resistance and Double Top Watch
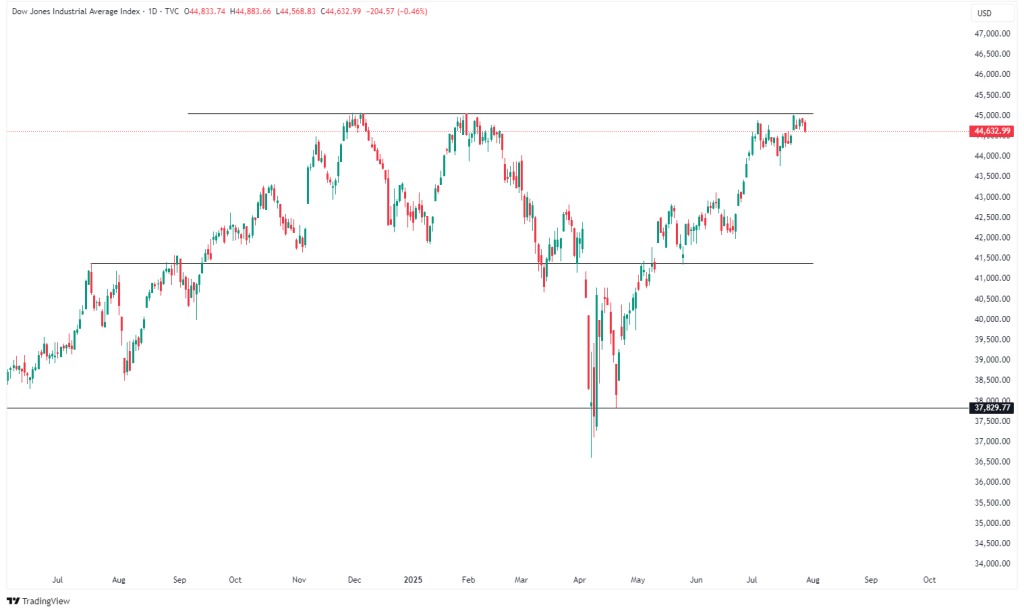
The daily chart of Dow Jones reveals an important resistance re-test near 45,000. The index is struggling to close above this level, forming a short-term potential double top pattern. Previous resistance-turned-support at 41,500 becomes crucial in case of a correction.
Momentum is clearly slowing down, and the lack of bullish follow-through at ATH-level resistance is a warning sign. Watch for confirmation through candlestick rejection or a trendline breakdown for short bias.
GBP / USD – Trendline Breakdown Impact
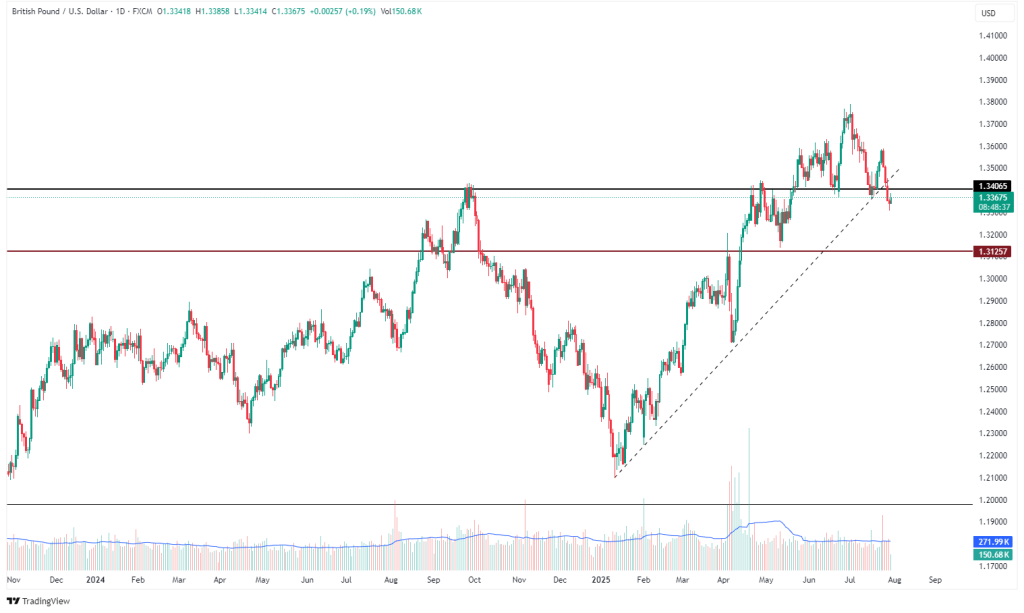
GBP/USD is in a vulnerable position after breaking below the rising trendline support that carried the rally since February 2025. Price is now trading slightly below the 1.3400 mark, a major horizontal resistance zone. Volume remains high but lacks direction.
The next critical downside target lies around 1.3125, which previously acted as resistance-turned-support. Unless buyers regain 1.3400 with conviction, this trendline breakdown could mark a larger structural shift.
Key techniques used: Trendline break, support/resistance, volume divergence.
Bitcoin / USDT– Compression Pattern Near $120K
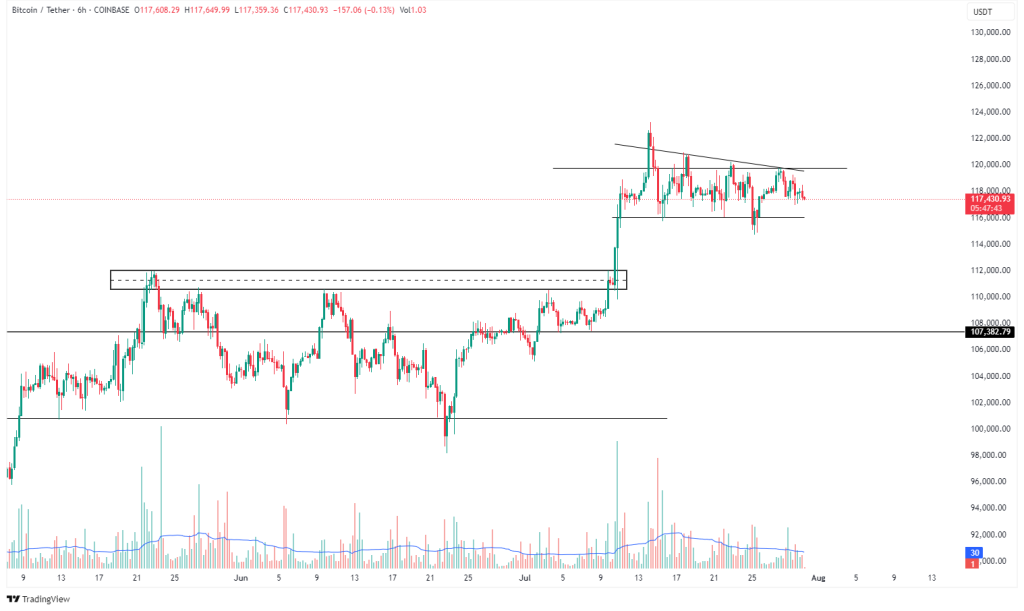
Bitcoin’s price structure on the 6H chart shows clear lower highs forming a descending triangle pattern, signaling compression. Despite repeated defenses around the $116,000 support zone, bulls have failed to break above the $119,500-$120,000 resistance.
This consolidation just after a massive breakout suggests either distribution or continuation. A break below $116K could trigger a rapid fall toward $108K, while an upside breakout could revive bullish momentum.


Leave A Comment