

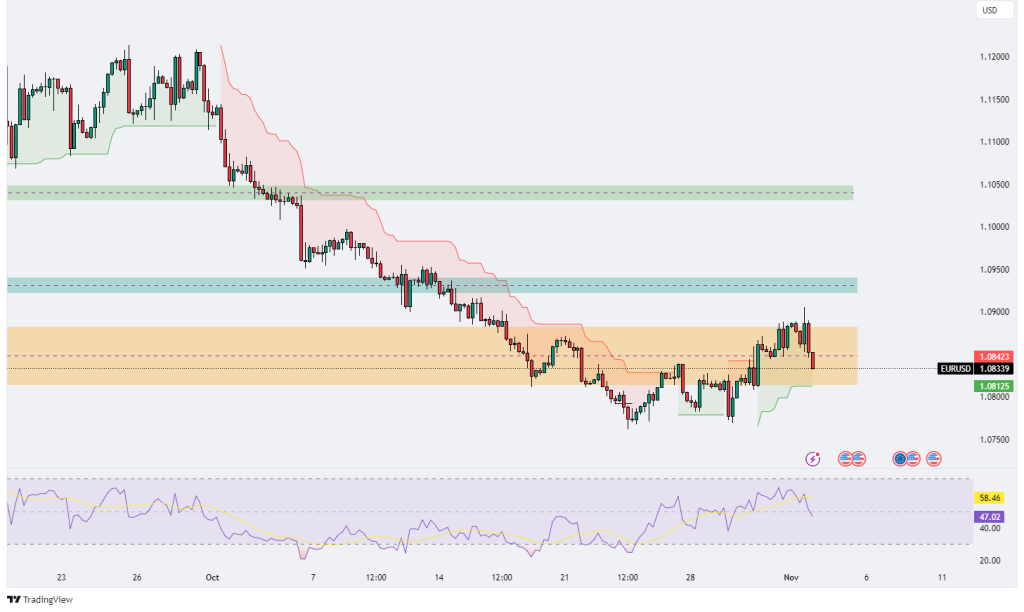
EURUSD
The EUR/USD chart reflects an ongoing bearish trend, recently interrupted by a short-lived upward correction that pushed the price into a key resistance zone around 1.08423, only to face strong rejection. Currently trading near 1.08339, the price has repeatedly encountered resistance in the orange-shaded zone, indicating that this area continues to act as a firm ceiling for bullish attempts. Every test of this resistance has been met with seller dominance, pushing the price back down and reinforcing the bearish sentiment. The short-term correction was insufficient to shift the broader downtrend, and the current price action suggests that sellers are firmly in control. Adding to this outlook, the Ichimoku cloud, which briefly turned green during the correction, is beginning to act as resistance again, indicating that the bullish momentum from this recent rally lacks substantial support. The thin nature of the cloud suggests that it does not provide strong backing for upward moves, making it easier for the price to continue its descent if selling pressure intensifies. The Relative Strength Index (RSI) supports this view, currently sitting at 47.02 after dropping from a recent peak of 58.46. This downward shift in the RSI reflects a loss of bullish momentum and a return of selling pressure, reinforcing the likelihood of further declines. The immediate support level at 1.08125 is crucial; a break below this level could open the door to a continuation of the downtrend, with the potential for the price to revisit lower support zones. Conversely, to change the current outlook to neutral or bullish, the price would need to break and sustain above the 1.08423 resistance level, though this seems unlikely given the recent rejection. Overall, EUR/USD appears poised to maintain its bearish trajectory unless buyers can decisively overcome resistance, with the technical indicators and price action favoring further downside in the near term.
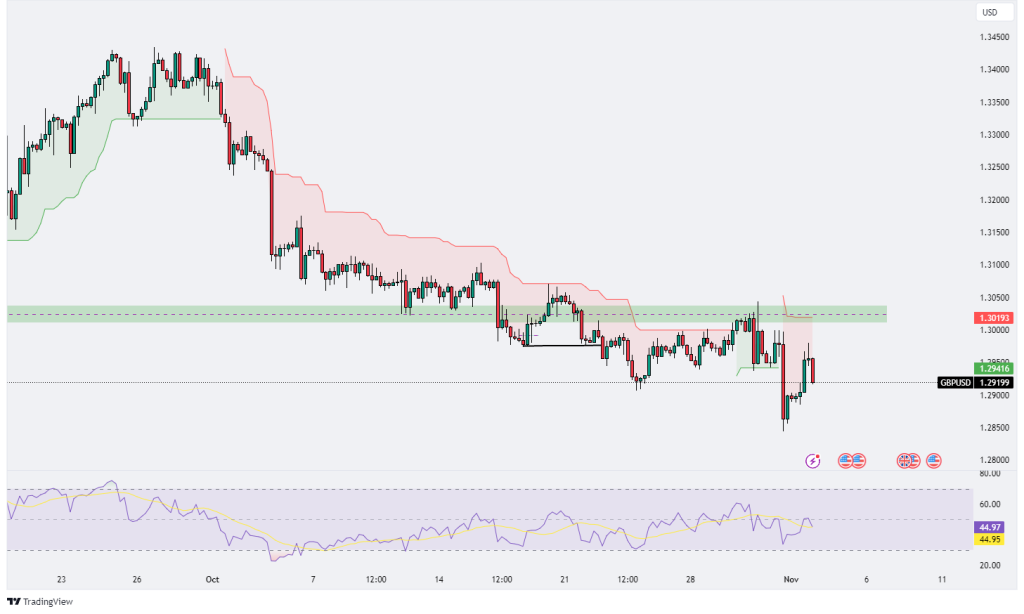
GBPUSD
The GBP/USD chart displays a predominantly bearish trend, with recent price action showing failed attempts to break above a significant resistance zone around 1.30193, marked by the green shaded area. After a minor recovery, the price was met with strong resistance at this level, which has previously acted as a pivotal support-turned-resistance, reinforcing its importance in the current bearish structure. The price is now trading around 1.29199, suggesting that sellers have regained control after the latest rejection at the resistance zone. The Ichimoku cloud above the price is red, underscoring continued bearish momentum, as the price remains well below the cloud, with no indication of an impending breakout above it. This configuration implies that the bearish sentiment is likely to persist unless there is a decisive move above the resistance. The Relative Strength Index (RSI) sits around 44.97, below the neutral 50 mark, which reflects subdued bullish momentum and indicates that the market lacks the strength needed to shift from its bearish stance. The RSI’s decline from earlier levels suggests a weakening attempt by buyers and a return of selling pressure, making it more probable for the price to continue testing lower levels. Overall, the GBP/USD pair is likely to remain under pressure, with the key resistance at 1.30193 serving as a strong barrier that needs to be broken to shift the outlook. Until such a breakout occurs, the technical indicators favor continued downside movement, and any further declines may see the price gravitating toward lower support levels as the broader bearish trend remains intact.
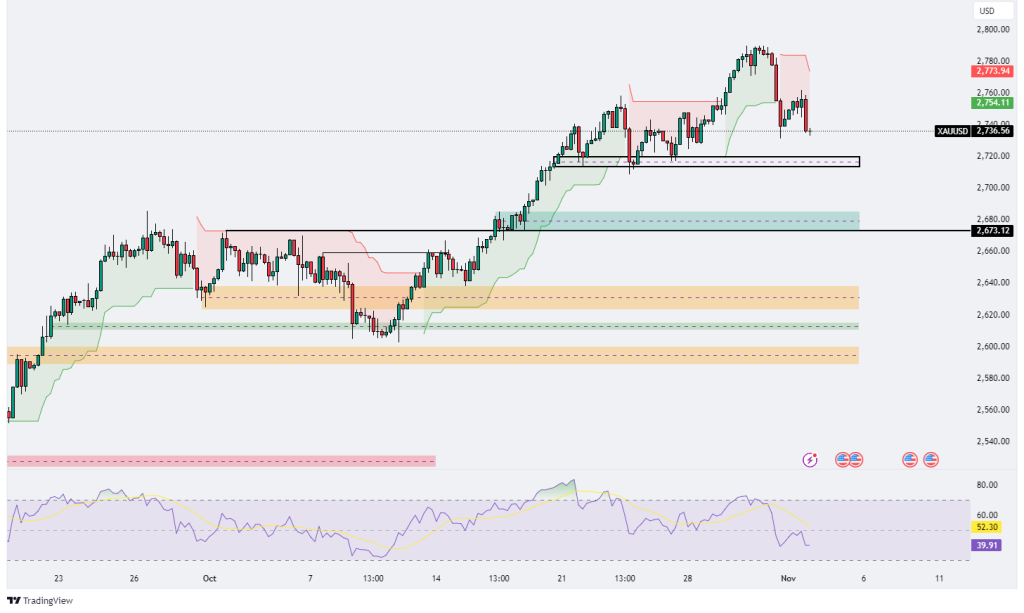
XAUUSD
The XAU/USD chart shows a strong uptrend that recently faced a pullback, with the price currently around 2736.56. After reaching a high near 2773.94, which acted as a resistance level, the price has reversed, suggesting some profit-taking or selling pressure at these elevated levels. This reversal has brought Gold down to a critical support level around 2730, marked by a horizontal black line. This level has previously served as a base for bullish moves, and if it holds, it could provide the foundation for another upward push. Below this, additional support is visible near 2673.12, where a previous consolidation phase occurred, indicated by the green shaded area. This lower support would be a key level to watch if the current pullback deepens. The Ichimoku cloud remains green and supportive below the price, reinforcing the overall bullish bias, although the current proximity of the price to the cloud suggests that further selling could bring it closer to the cloud, potentially testing its strength as support. The Relative Strength Index (RSI) is at 39.91, falling from earlier highs and indicating weakening momentum. This RSI level suggests that bearish pressure has increased, although it’s not yet oversold, leaving room for further downside if sellers remain active. Overall, the XAU/USD trend is still bullish, but the recent pullback below resistance and the RSI’s decline point to a potential period of consolidation or correction before any further advance. If the 2730 support level fails to hold, the next target for bears would be the stronger support around 2673.12, where buyers may find more attractive entry points to continue the uptrend. Conversely, if support holds and momentum recovers, Gold could retest the 2773.94 resistance, with a potential for further gains if buyers regain control.
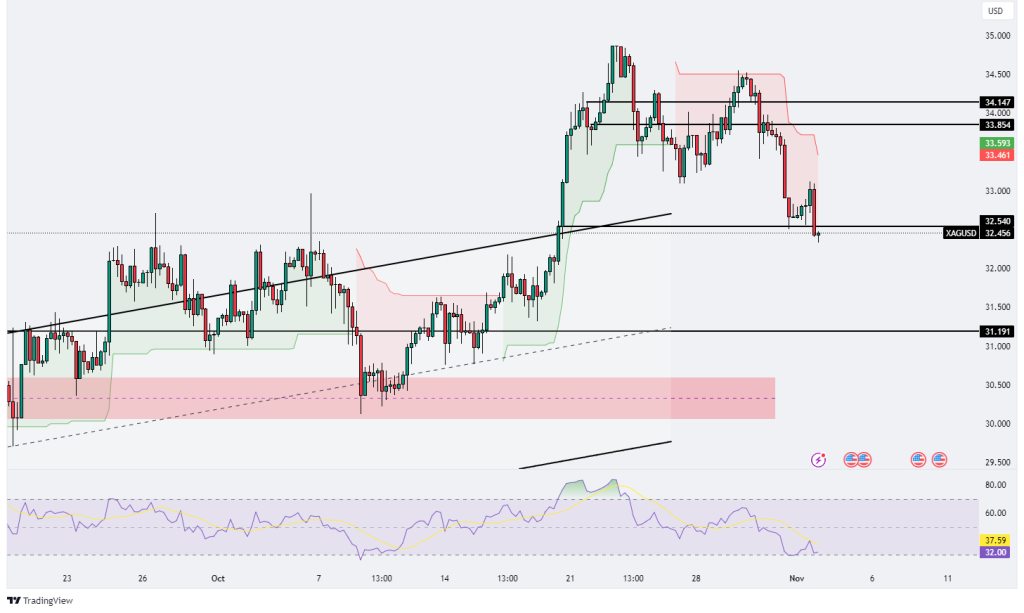
XAGUSD
The XAG/USD chart reveals a recent breakdown in what had been a strong bullish trend, with the price currently trading around 32.456. After reaching a high near 34.147, the price faced significant selling pressure and has since retraced below key support levels, including the critical area at 32.540, which previously acted as a trendline support. This level, now breached, signals a shift in sentiment, as sellers have taken control, pushing the price down from its highs. The Ichimoku cloud, which had been green during the uptrend, is now turning red above the current price level, highlighting the recent loss of bullish momentum and suggesting that the cloud could serve as resistance if the price attempts to recover. This bearish shift in the cloud indicates a potential continuation of the downside, especially as the breakdown below support levels suggests that Silver may be entering a more prolonged corrective phase. Further supporting the bearish outlook is the Relative Strength Index (RSI), which is currently around 32.00, nearing oversold conditions. The RSI’s descent from previous higher levels reflects the rapid shift in momentum, confirming that selling pressure has increased sharply. However, the RSI nearing oversold territory could indicate a potential pause or slight rebound if buyers re-enter at these lower levels, although such a move may be temporary given the current technical weakness. If the price continues to decline, the next major support level to watch is around 31.191, which marks a previous consolidation area that could attract buying interest. Conversely, if there is a recovery, the recently breached 32.540 level would need to be reclaimed and sustained for Silver to regain any bullish footing, though resistance above at 33.593 and 34.147 could further limit the upside.


Leave A Comment