

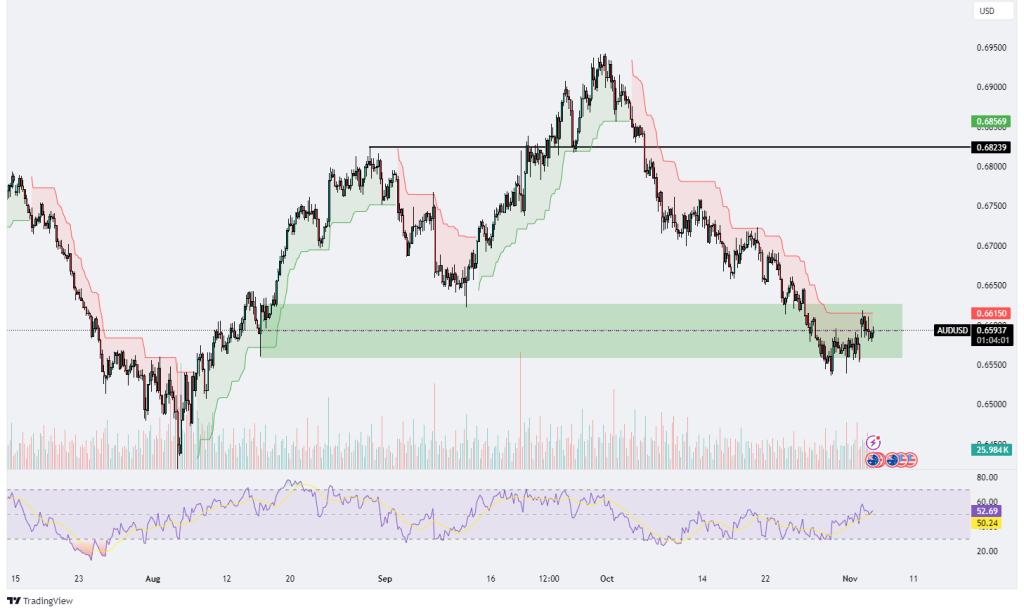
AUDUSD
The AUD/USD chart reveals a sustained bearish trend with recent attempts at a recovery, although it faces significant resistance within the 0.66150 level, marked by the upper boundary of the green shaded area. After a prolonged decline from the highs around 0.68569, the price has settled into a consolidation zone, testing both support and resistance within this range. The Ichimoku cloud, which remains red and hovers above the current price, reinforces the bearish sentiment and could act as a resistance zone if the price attempts further upward moves. The RSI indicator currently sits around 52.62, just slightly above the neutral 50 mark, indicating mild bullish momentum but without a definitive breakout signal. This RSI level suggests that buyers are attempting to gain control, but the overall sentiment remains cautious, as the RSI has not reached overbought levels that would indicate a strong bullish reversal. Volume levels appear relatively stable, lacking the strong buying spikes that would suggest robust bullish commitment to break past the resistance zone. If the price fails to move decisively above 0.66150, the downtrend could resume, pushing AUD/USD back toward lower support levels within the shaded area, which has provided stability in previous declines. However, a confirmed breakout above the resistance and Ichimoku cloud could indicate a potential reversal, targeting higher levels around 0.68239. For now, the chart suggests that while there are signs of a temporary recovery, the bearish trend is likely to persist unless buyers can overcome the key resistance levels and establish a sustained move above the Ichimoku cloud.
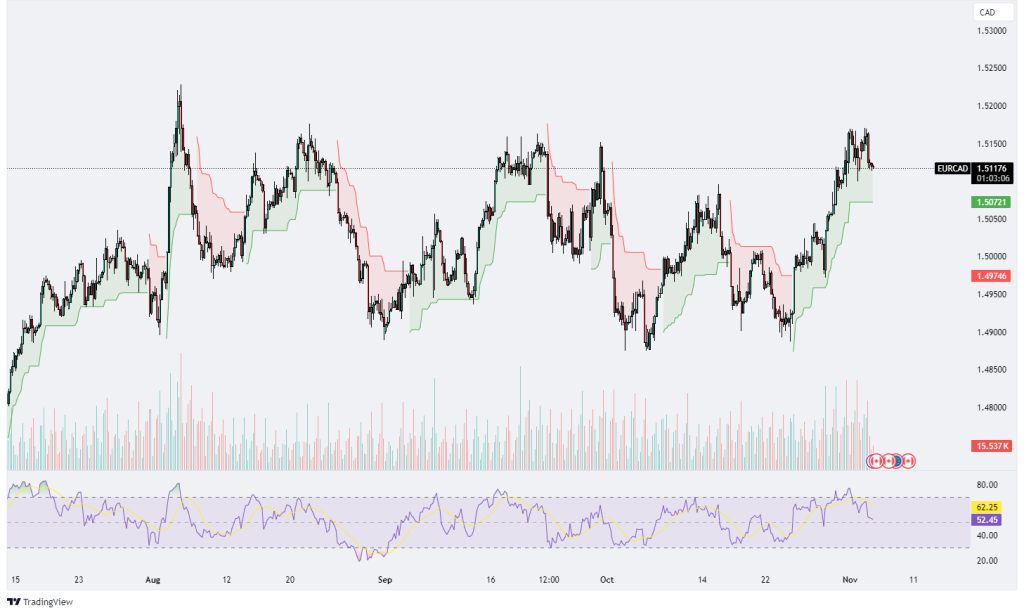
EURCAD
The EUR/CAD chart shows a fluctuating range-bound market, with recent upward movement reaching around 1.51178 before encountering resistance and starting to pull back slightly. Over the past few months, the pair has oscillated within a wide range, repeatedly testing both support and resistance zones, highlighting indecision and a lack of sustained trend direction. The current price action, while above the Ichimoku cloud, shows some signs of losing upward momentum, as the RSI has recently dropped from an overbought zone, now sitting around 62.25. This suggests that while bullish sentiment is still present, it may be weakening, leaving room for potential consolidation or a minor retracement. The Ichimoku cloud itself has a supportive green zone under the current price level, indicating that the overall trend remains slightly bullish in the near term. However, previous price action has shown that rallies are often met with selling pressure before reaching significant highs, suggesting the possibility of continued volatility. Volume levels do not show a strong increase, implying that recent moves may lack the robust participation needed to fuel a strong breakout. If the pullback continues, the price may find support around the cloud’s upper boundary near 1.50721, a level that could attract buying interest if the bullish outlook holds. In contrast, a breakdown below the cloud might suggest a reversal toward the lower part of the range, around 1.49746 or lower, depending on momentum. Overall, the EUR/CAD remains range-bound with a slight bullish tilt, but recent resistance and a declining RSI indicate that traders should watch for potential signs of reversal or consolidation in the coming sessions, with key support and resistance levels likely dictating the next direction.
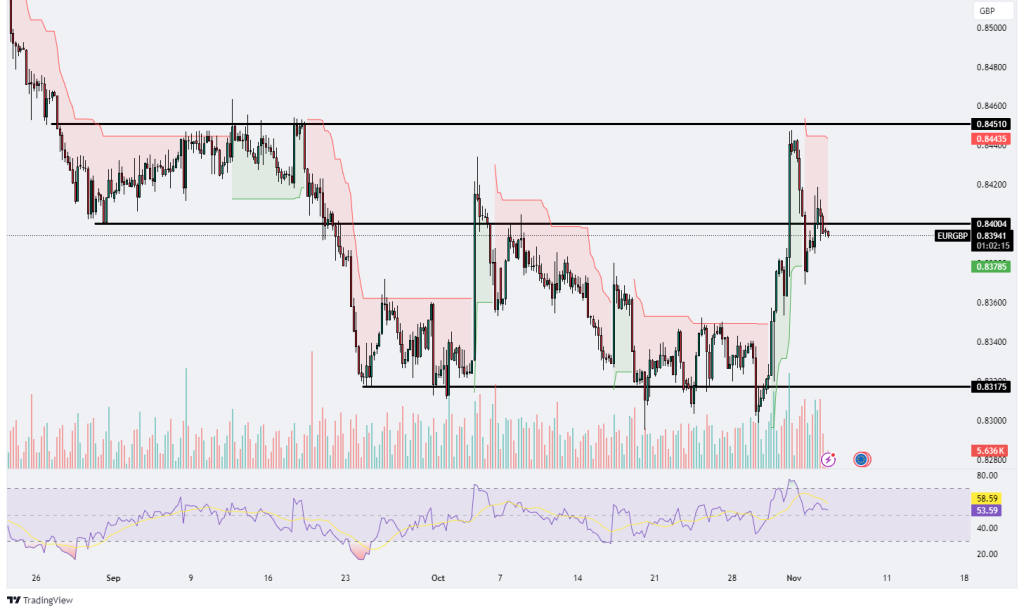
EURGBP
The EUR/GBP chart shows a recent bullish breakout from a previously established consolidation range, with the price reaching a high near 0.84510 before encountering resistance. Currently trading around 0.83941, the price is now consolidating just above a key support level at 0.83785, which had previously acted as resistance within the trading range. This breakout above the range suggests an attempt by bulls to take control, although the subsequent pullback indicates that sellers are stepping in at higher levels, particularly near the 0.84510 resistance. The Ichimoku cloud below the price has shifted from red to green, reflecting a bullish bias in the short term and providing underlying support if the price attempts to hold above 0.83785. Volume data suggests a spike during the breakout, indicating increased interest and participation from traders, though the volume has since decreased, implying some hesitation or profit-taking at the higher levels. The Relative Strength Index (RSI) currently sits at 53.59, down from its recent high of around 58.59, suggesting a slight weakening in bullish momentum as the RSI edges closer to the neutral 50 level. This RSI trend hints that while the bullish momentum is still intact, it has moderated, and a further drop could indicate a deeper correction toward support levels. If the price fails to hold above 0.83785, it could revisit lower support levels around 0.83175, which acted as the lower boundary of the previous consolidation range. Conversely, a successful defense of the 0.83785 support and a push higher could see EUR/GBP retest the recent highs around 0.84510, with a break above this level potentially opening the way for further gains. Overall, while the breakout indicates a shift in momentum, the current pullback and declining RSI suggest that the market may consolidate before determining its next direction, with key levels at 0.83785 and 0.84510 likely to play a crucial role in shaping the trend.
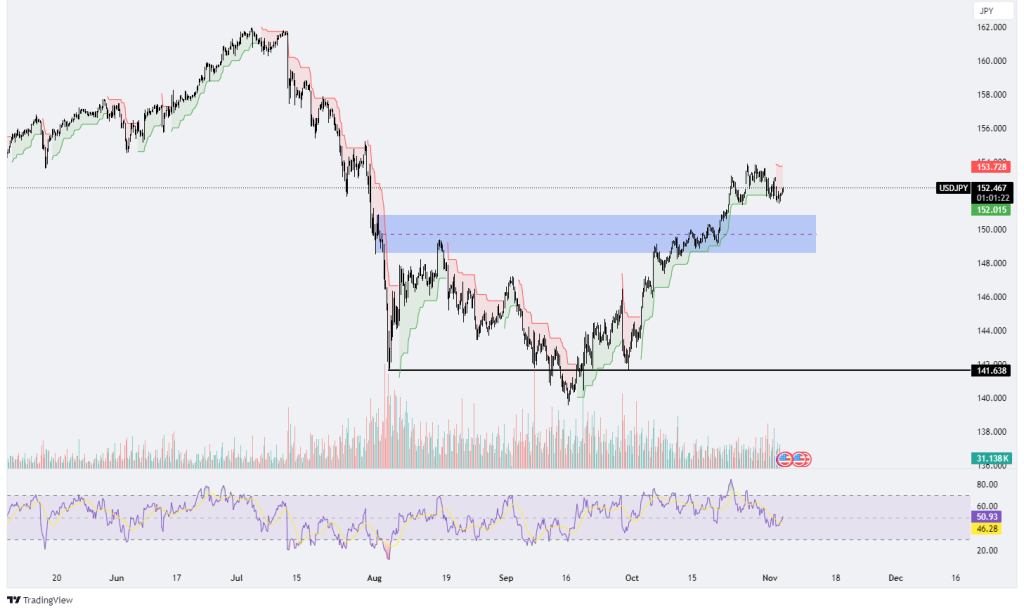
USDJPY
The USD/JPY chart reflects a strong bullish trend, with the price currently trading around 152.467 after a steady upward movement that started from the major support level near 141.638. This rally has pushed the price above a significant resistance zone around 152.015, highlighted by the blue shaded area, which has now turned into a support level. The breakout above this zone indicates strong buying momentum, though the price is now approaching resistance at 153.728, where sellers may step in to cap further gains. The Ichimoku cloud is green and supportive under the current price, indicating sustained bullish sentiment and reinforcing the trend, as the cloud has held firm as support during previous pullbacks. This cloud configuration suggests that as long as the price stays above it, the bullish trend is likely to continue. The Relative Strength Index (RSI) currently sits at 50.93, just above the neutral 50 mark, showing moderate bullish momentum. However, the RSI has been fluctuating, suggesting some hesitation among buyers at current levels. This positioning of the RSI could mean that the market is pausing before a potential continuation of the trend, or it might signal a possible consolidation phase if momentum weakens further. Volume has been relatively steady, with no extreme spikes, indicating balanced participation, though the lack of a strong volume surge suggests that traders may be cautious at these higher levels. If the price breaks above the 153.728 resistance, it could trigger a fresh wave of buying, pushing USD/JPY higher toward new highs. Conversely, if resistance holds and the price falls below 152.015, it could lead to a pullback toward the Ichimoku cloud, where the next support lies. Overall, the outlook remains bullish, but the price is at a crucial level where the next move will likely be determined by the strength of buyers against the resistance at 153.728 and the ability to hold above the newly established support at 152.015.


Leave A Comment