

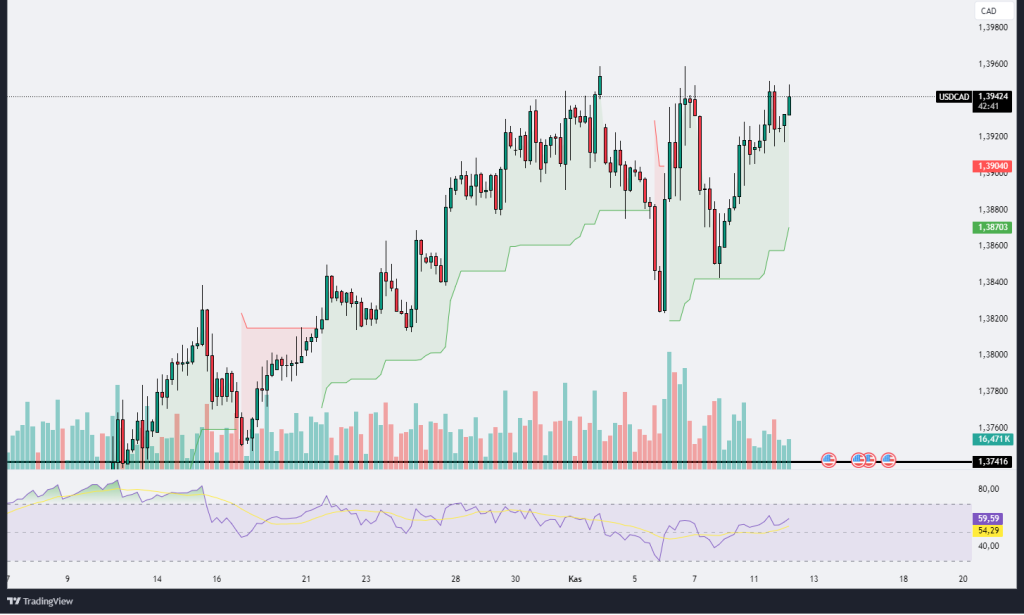
USDCAD
The USD/CAD chart displays a robust uptrend, with the price currently trading around 1.3942, approaching a recent resistance level near 1.3950. This strength in USD against CAD aligns with a series of higher highs and higher lows, indicating consistent bullish momentum. The Ichimoku cloud, which is largely green, supports this upward trend by acting as dynamic support, with the price frequently bouncing off it. Volume patterns show periodic spikes, particularly during bullish moves, suggesting strong buying interest at key levels. The Relative Strength Index (RSI) is trending upward, sitting around 59.59, which is below overbought territory, leaving room for potential upside movement without immediate reversal risk. If the price breaks above the 1.3950 resistance, it could see further gains, possibly challenging higher levels around 1.4000. On the downside, should the price face rejection at current levels, it may pull back to test the Ichimoku cloud support, near 1.3870, before potentially resuming its uptrend. Overall, the technical indicators and volume analysis suggest a favorable outlook for USD/CAD, though traders should watch for any significant resistance near the current high that might indicate short-term profit-taking.
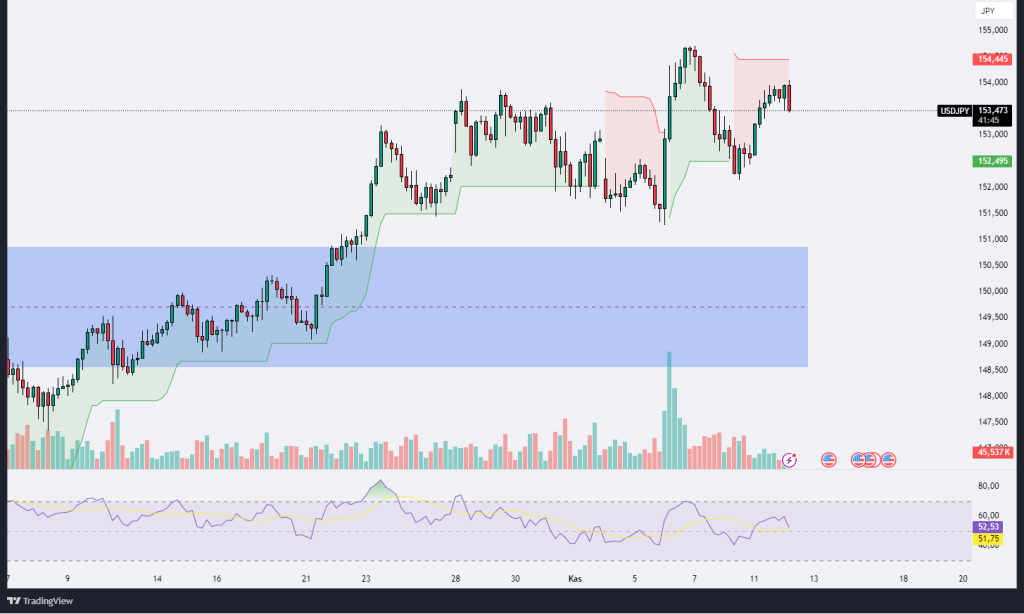
USDJPY
The USD/JPY chart reveals a relatively strong uptrend, with the price fluctuating near the 153.50 mark after previously testing the resistance level around 154.50. This recent consolidation indicates a potential pause in the bullish momentum, with buyers facing resistance that could impact further upside progress. The Ichimoku cloud below provides a dynamic support area, suggesting that, unless a significant breakdown occurs, the uptrend could still have room to extend. The visible blue zone indicates a former accumulation phase around the 150.00 level, which provided a solid base for the recent upward movement, reflecting a strong support area should the price retrace further. Volume patterns show intermittent surges, particularly during upward pushes, indicating periods of intensified buying interest. However, the Relative Strength Index (RSI) currently hovers around 51.75, suggesting a balanced momentum with neither overbought nor oversold conditions, which could allow the pair to resume its uptrend or test lower support levels without major reversals. A sustained move above the 154.50 resistance could open the path towards new highs, while failure to break this level may lead to consolidation or a retracement toward the Ichimoku cloud or the 152.50 support. This analysis indicates a market at a critical juncture, with traders likely watching the 154.50 resistance for breakout cues or a return to support zones for potential buying opportunities.
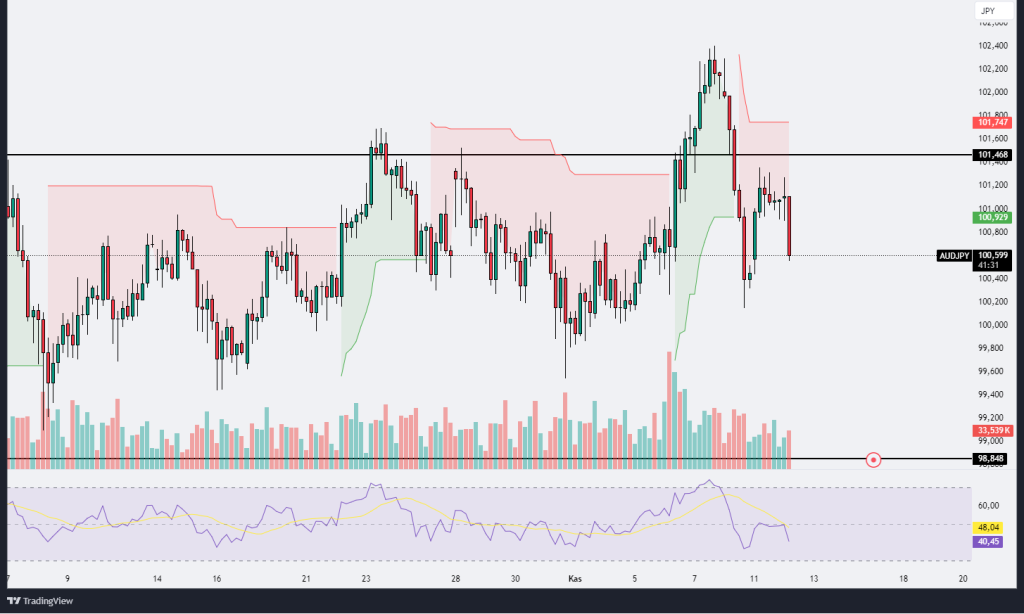
AUDJPY
The AUD/JPY chart currently shows a consolidation phase below the key resistance level at 101.468, indicating uncertainty in the trend direction. After a recent attempt to breach this resistance, the price has retraced and now hovers around 100.612. The Ichimoku cloud highlights a mix of bearish and bullish zones, suggesting indecision, with recent price action oscillating between the cloud’s edges. The significant volume spike during recent trading sessions reflects heightened interest, possibly due to the battle between bulls and bears near the resistance. However, the Relative Strength Index (RSI) is currently at 40.64, nearing oversold territory, which might indicate that the selling pressure could diminish if it continues downward. If the pair fails to hold above the psychological support of 100.00, further downside could be tested, possibly approaching the next support level around 98.848. Conversely, a break above 101.468 would signal renewed bullish momentum, potentially leading to a stronger uptrend. The market appears at a critical juncture, with a possible directional move depending on whether it can sustain above or below these pivotal levels.
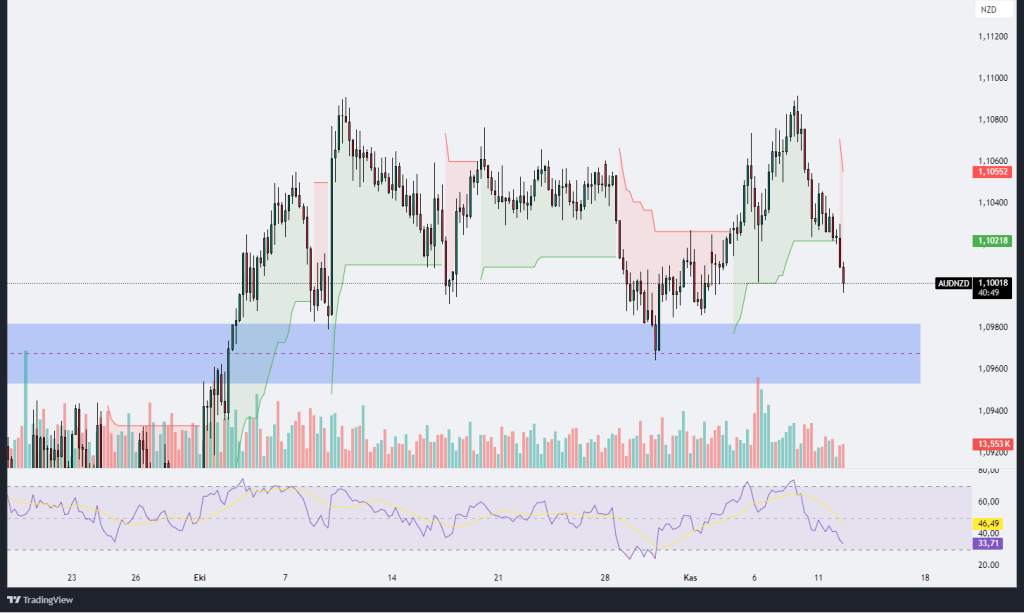
AUDNZD
The AUD/NZD chart currently shows a bearish momentum, as price action is trending downward, breaking below the Ichimoku cloud support, which indicates potential for further downside. The pair is approaching a significant demand zone, highlighted in blue, which has previously acted as a support area, indicating that buyers might step in to defend this level. The volume has increased during the recent sell-off, suggesting strong selling pressure. Additionally, the Relative Strength Index (RSI) is at 33.77, which puts it near oversold territory. This could indicate that, while the pair is under bearish control, there may be a chance for a reversal or at least a temporary relief bounce if the support zone holds. A break below the demand zone, however, could lead to further downside continuation, potentially exposing lower support levels. On the other hand, if the price finds support within this zone, we might see a bounce back toward the Ichimoku cloud resistance or a potential retest of the recent breakdown level around 1.10552. Traders should watch the response in this key support area, as it will likely provide clues about the AUD/NZD’s next directional move.


Leave A Comment