


EURUSD
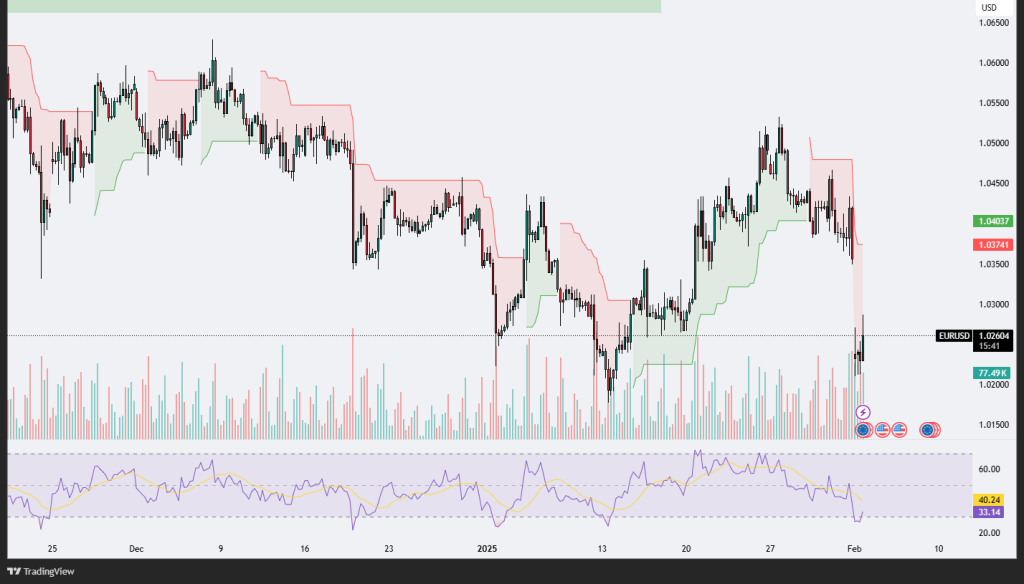
The EUR/USD chart demonstrates a sharp decline, breaking through key support levels to reach approximately 1.0260, marking a significant bearish move. This downward momentum is accompanied by a spike in trading volume, suggesting strong selling pressure and heightened market activity. The Supertrend indicator has turned decisively bearish, reinforcing the downtrend outlook. Additionally, the RSI has dropped into oversold territory, hovering around 33, signaling that the pair may be oversold in the short term, but also highlighting the intensity of the current selling momentum.
The price action has breached previous levels of consolidation, indicating that sellers are firmly in control. However, the oversold RSI suggests a potential for a corrective pullback or a consolidation phase before the next directional move. Traders should watch for any recovery attempts toward resistance at 1.0374, as this level might act as a retest zone for the bears. Conversely, continued bearish momentum could push the price lower toward psychological levels such as 1.0200 or below. The volume profile also indicates strong interest at these lower levels, and any sustained break could open further downside potential. Market participants should monitor macroeconomic catalysts that may drive further volatility in the pair.
GBPUSD
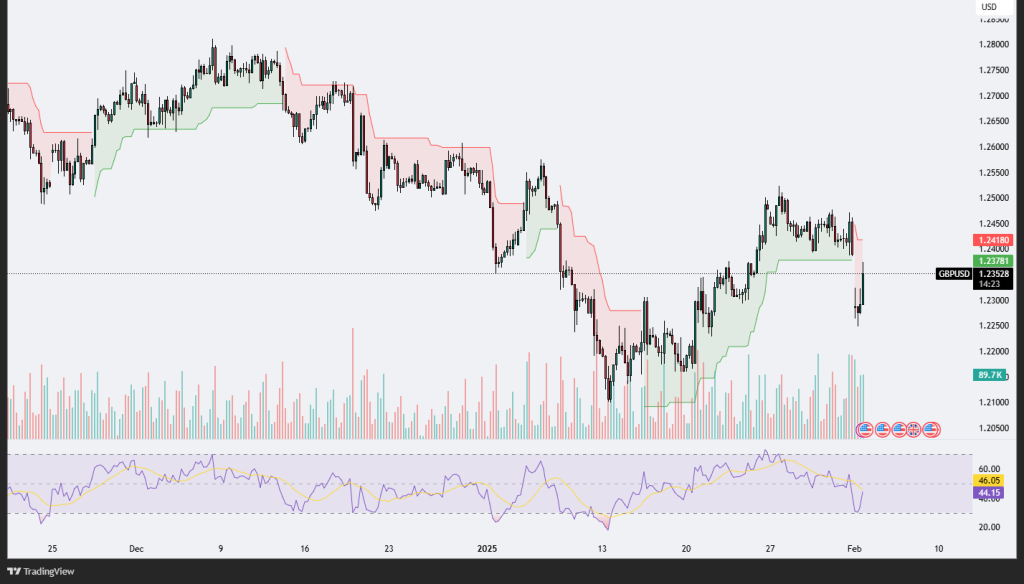
The GBP/USD chart displays a sharp reversal after testing higher levels near 1.2450, now retreating and trading around 1.2378. The Supertrend indicator shows a shift to a bearish zone following the recent downward momentum. A significant increase in trading volume accompanies this price action, indicating strong participation during the decline. The Relative Strength Index (RSI) has moved downward from near overbought territory to the lower 40s, suggesting weakening bullish momentum and increased bearish pressure.
The price action shows that GBP/USD failed to sustain the breakout above recent resistance and encountered selling pressure near key levels. The subsequent decline breached the short-term support zone, which may now act as resistance if the price attempts a recovery. The increased volume during the drop further confirms the bearish sentiment in the short term. If the pair continues lower, the next support area around 1.2300 could be tested. On the other hand, if a recovery occurs, a close above 1.2418 will be necessary to regain bullish confidence. Traders should monitor macroeconomic developments and U.S. dollar strength for further directional cues, as volatility appears to be elevated in the pair.
XAUUSD
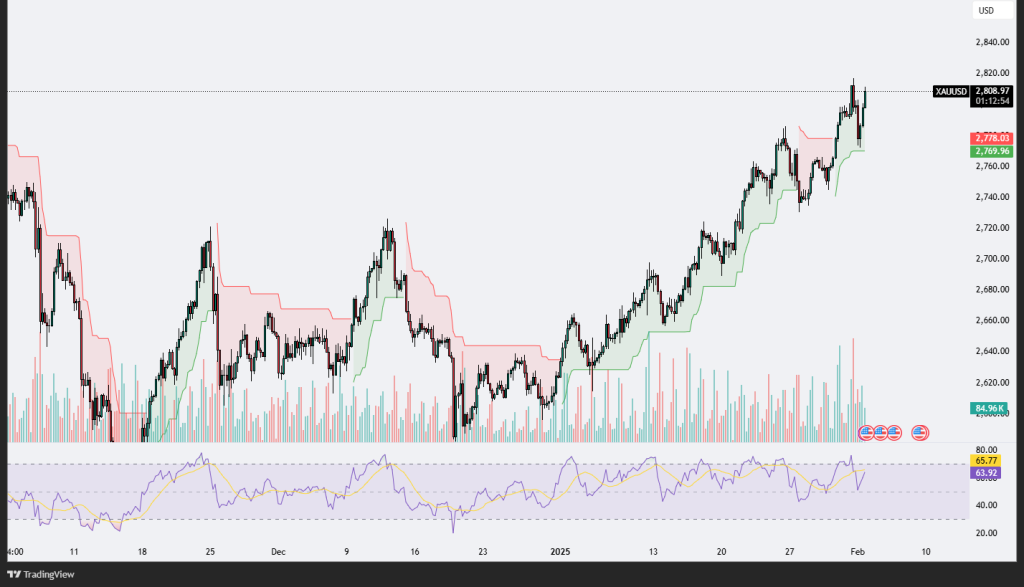
The XAU/USD (Gold/US Dollar) chart reflects strong bullish momentum as prices are trading near the 2,808 level, following a sustained upward trend over recent weeks. The chart highlights a consistent series of higher highs and higher lows, underpinned by robust buying interest, as indicated by the increasing volume bars that accompany each price surge. The Supertrend indicator has remained in the green zone, further validating the persistent bullish sentiment in the market. Recent price action shows a brief pullback to the 2,770 region, which acted as support, followed by a sharp rebound, confirming the resilience of buyers.
The Relative Strength Index (RSI) is currently in the mid-60s, suggesting that while the bullish momentum remains intact, the market has not yet entered overbought territory, leaving room for further upside potential. However, traders should monitor the RSI closely as it approaches overbought levels, which could signal a potential slowdown or consolidation. A breakout above the 2,820 resistance level could pave the way for a retest of higher levels, while failure to sustain above 2,770 may lead to a deeper correction. The overall technical outlook remains bullish, with traders likely to capitalize on dips as buying opportunities in this strong uptrend.
XAGUUSD
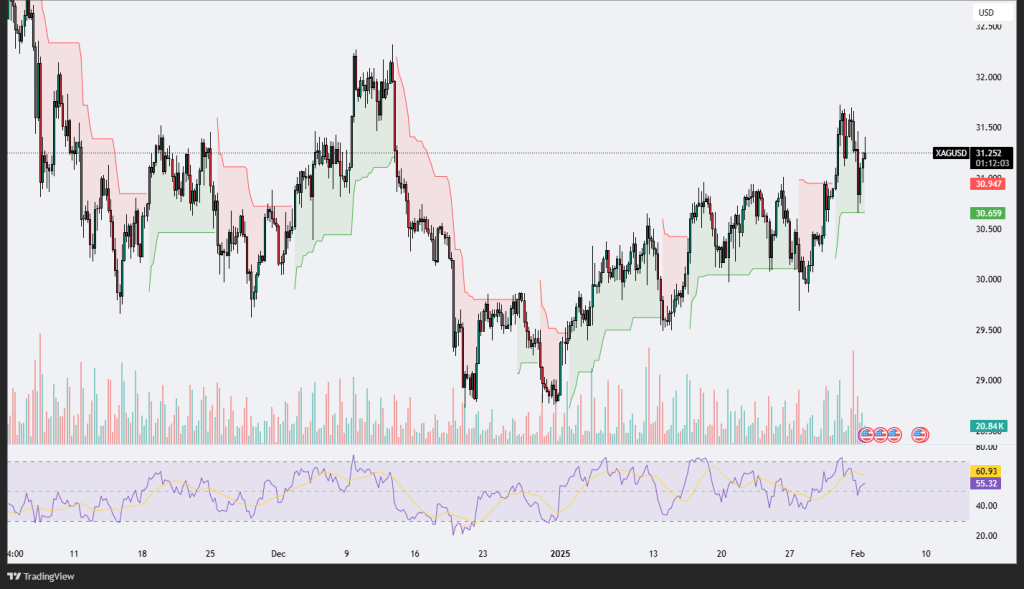
The XAG/USD (Silver/US Dollar) chart exhibits a notable recovery, with prices currently trading near the 31.25 level after a sharp rally from the 30.00 region. The Supertrend indicator remains in a green zone, reflecting an overall bullish bias, although recent price action shows a retracement from the 31.50 high. This pullback may be viewed as a consolidation phase within a broader upward trend. The volume analysis suggests increasing interest during the rallies, indicating strong buying momentum, while the declining volume during pullbacks further supports the bullish case.
The RSI currently hovers around 60.93, indicating bullish momentum without being overbought, which leaves room for further gains. The key support level is around 30.65, marked by previous consolidation, and a break below this level could indicate a deeper correction. On the upside, a breakout above 31.50 would confirm the continuation of the uptrend, potentially targeting higher resistance levels near 32.00. The price action and technical indicators suggest that silver remains in a strong bullish phase, and any dips could present buying opportunities for traders aligned with the trend. However, maintaining a cautious approach around resistance levels and monitoring the RSI for overbought conditions would be prudent.


Leave A Comment