


USDNOK
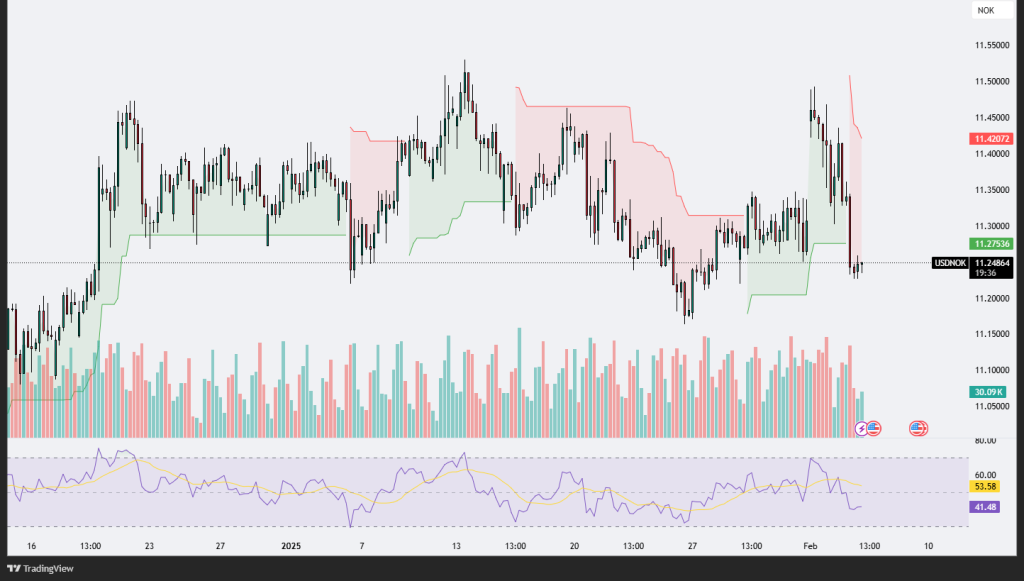
The USD/NOK chart shows a sharp decline after a failed attempt to sustain above the 11.4000 level, with the current price trading near 11.2500. The Supertrend indicator recently shifted to a bearish zone, signaling potential downside pressure. The drop was accompanied by a significant increase in trading volume, indicating strong selling momentum. The RSI has fallen below the neutral 50 mark and currently sits at 41.48, suggesting growing bearish momentum but not yet in oversold territory.
Key support is located around 11.2000, which aligns with previous consolidation zones. A break below this level could open the door for further declines toward the psychological level of 11.1000. On the upside, resistance is clearly defined at 11.4000, with a further barrier at 11.5000. The failure to hold above the 11.4000 mark and the subsequent bearish breakdown suggest a shift in market sentiment, possibly driven by external factors such as economic data or central bank actions.
Traders should monitor for a potential retest of the 11.2000 support level, as a bounce could offer short-term buying opportunities. However, the overall bias leans bearish unless the price regains momentum above 11.4000 with strong buying volume. For now, the combination of bearish technical indicators and increased selling pressure suggests caution for long positions, with a focus on key support and resistance levels for future direction.
GBPJPY
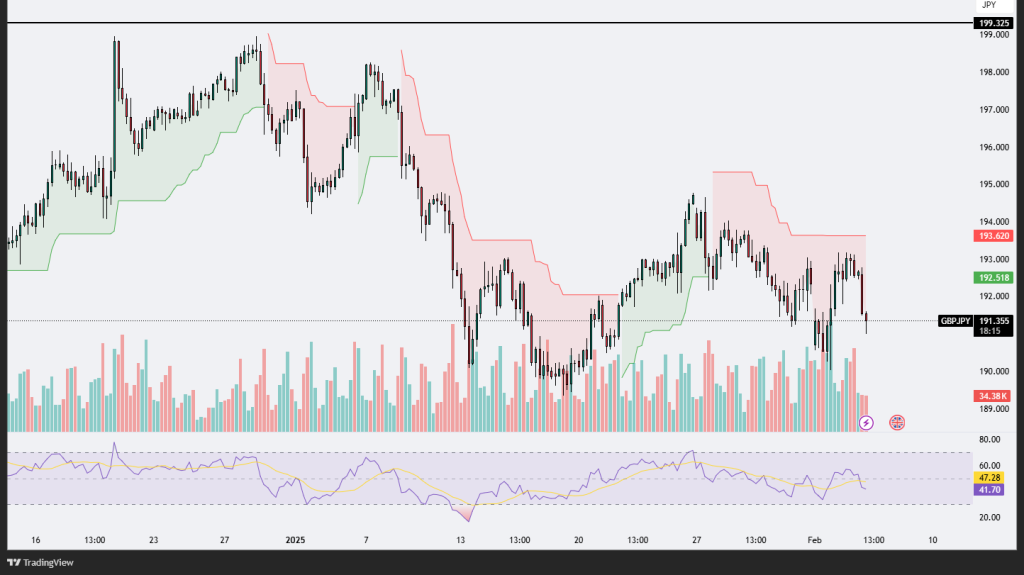
The GBP/JPY chart indicates significant bearish pressure as the pair currently trades around 191.35, below the key psychological support of 192.00. The recent price action reveals a rejection from the 193.60 resistance zone, with the Supertrend indicator firmly in the red, signaling a bearish trend continuation. The drop is accompanied by increased selling volume, which highlights strong bearish momentum. The RSI is positioned at 41.70, reflecting bearish conditions but not yet oversold, suggesting further downside potential.
The next critical support lies near 190.50, a level that has previously acted as a consolidation zone. A break below this level could lead to a deeper correction, targeting the 189.00 level. On the upside, the resistance at 193.60 remains a critical barrier, and any recovery attempt would need to clear this level decisively to shift sentiment. However, with the RSI trending lower and the price firmly below the Supertrend, a bullish reversal seems unlikely in the short term.
Traders should watch for further volume spikes and RSI movement to confirm momentum. A retest of 192.00 could offer a short-selling opportunity if the level holds as resistance. Overall, the technical setup points to sustained bearish dominance unless the pair can reclaim levels above 193.60 with significant bullish volume.
AUDCHF
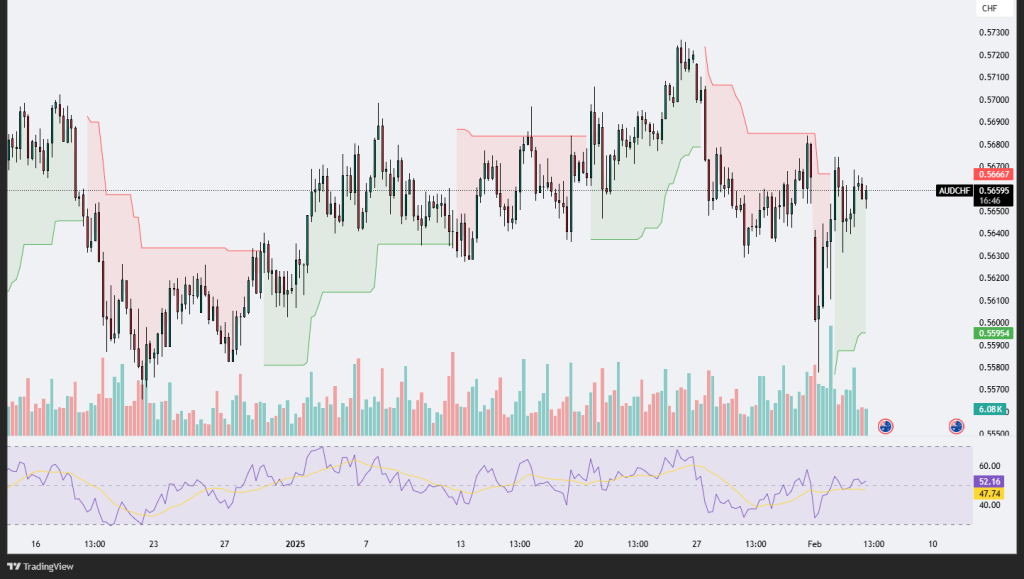
The chart represents the AUD/CHF currency pair, showcasing a relatively neutral trend with fluctuations between periods of bullish and bearish sentiment. The price is currently trading around 0.5659, indicating some recovery from the recent dip. The supertrend indicator alternates between red and green zones, signaling indecision or mixed sentiment in the market. This uncertainty is further reflected in the Relative Strength Index (RSI), which hovers near the midpoint at 52, suggesting neither overbought nor oversold conditions. The volume remains moderate, with no substantial spikes to suggest strong buying or selling pressure. The recent attempt to breach 0.5667, marked by the red supertrend resistance, was met with selling pressure, pulling the price back into a consolidation phase. On the downside, support appears around 0.5595, a level that has previously held during bearish moves. Traders may consider watching for a decisive breakout above the resistance or a breakdown below support to confirm the next directional move, as current market conditions reflect consolidation within a defined range.
GBPUSD
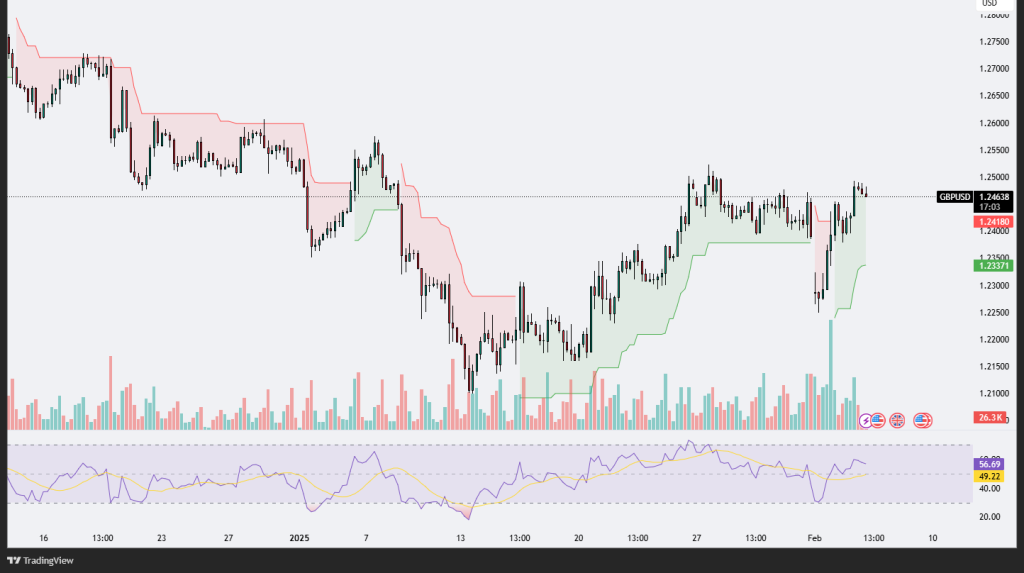
The GBP/USD chart exhibits a bullish recovery following a period of consolidation and downward movement earlier in the depicted timeline. The pair has steadily climbed to the 1.2465 level, with bullish momentum gaining traction as reflected by the green supertrend indicator, which has supported the price for the past few sessions. A significant increase in volume accompanies this upward trajectory, suggesting heightened trader activity and interest in the pair at these levels. The Relative Strength Index (RSI) has moved to 56.86, reflecting moderate bullish sentiment but still leaving room for further upward movement before entering overbought territory.
The previous resistance zone near 1.2418, marked by the red supertrend, has now been decisively broken, potentially turning into a new support level if the price retraces. The pair’s ability to hold above this level will be critical for maintaining bullish sentiment. Additionally, the 1.2336 area appears to be a secondary support level, as it has acted as a strong base for the recent upward movement. Traders may eye the next resistance near 1.2500, a psychological level that, if breached, could lead to further bullish continuation.
In summary, GBP/USD appears to be in a favorable uptrend, supported by increasing volume and bullish technical indicators. However, traders should remain cautious of potential retracements, especially if the RSI approaches overbought levels or if bearish divergence develops. A close below 1.2418 could signal a shift in momentum and a potential test of lower support levels.


Leave A Comment