


USDJPY
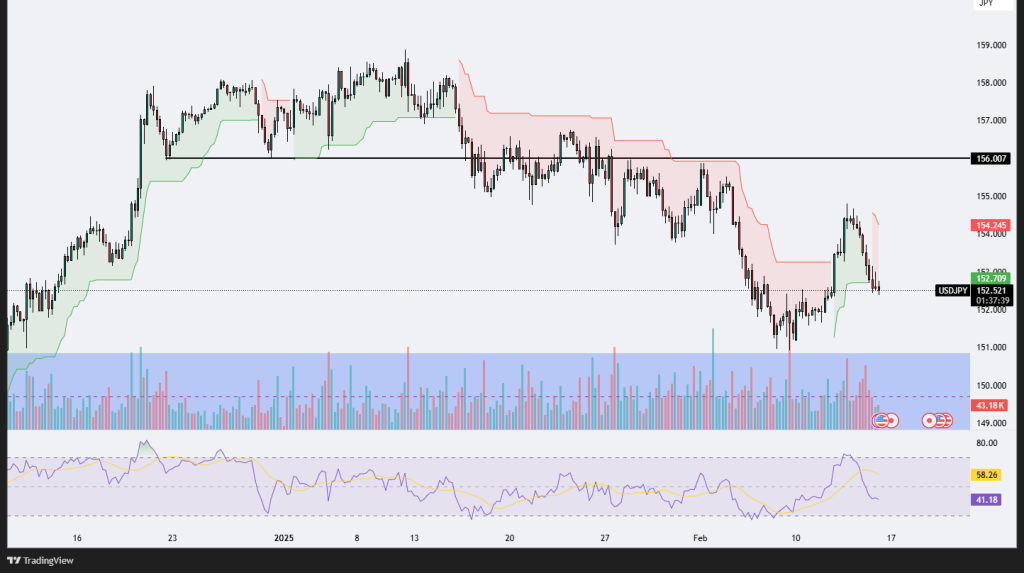
The USDJPY chart reflects a mixed market sentiment with recent volatility. The price is currently trading around 152.525, following a rejection from a key resistance level near 156.007. The rejection at this level indicates strong selling pressure, leading to a retracement. The Supertrend indicator is showing a transition from bearish to bullish momentum, but the recent pullback suggests that the bulls are struggling to maintain control.
Volume analysis reveals that there was a surge in bearish volume as the price approached the 154.245 resistance, leading to a sharp decline. This suggests that sellers are aggressively defending higher price levels. If selling volume remains strong, we might see further declines toward 152.000, where some buyers may attempt to regain control.
The Relative Strength Index (RSI) is currently at 41.23, which is approaching oversold conditions. However, the RSI has yet to dip below 40, which would confirm stronger bearish momentum. If the RSI bounces from this level, it could indicate a temporary relief rally or consolidation before the next major move.
From a technical perspective, 152.000 acts as a key short-term support level, and a breakdown below this zone could accelerate the downside move toward 150.500 or lower. On the other hand, if the price manages to hold above this level and gain momentum, buyers may attempt another push toward 154.000. However, breaking 156.007 remains a significant challenge unless bullish momentum strengthens.
Traders should watch for confirmation signals, such as a RSI rebound from oversold levels or a break above recent resistance zones to determine the next directional move. If the price fails to reclaim 154.000, the bearish pressure will likely persist.
USDCAD
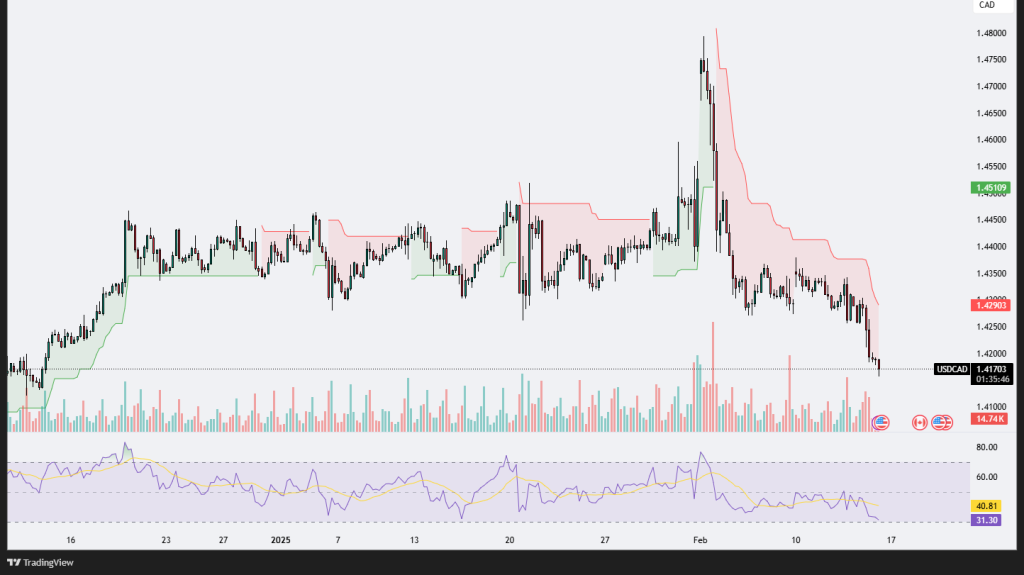
The USDCAD chart shows a strong bearish trend following a steep decline from recent highs near 1.4750. The price is currently trading around 1.4170, indicating continued selling pressure. The Supertrend indicator has remained in a bearish phase since the sharp drop, suggesting that momentum is still favoring the downside. The price action confirms a lower-high and lower-low structure, reinforcing the downtrend.
Volume analysis indicates that bearish volume has increased significantly during the decline, confirming strong seller dominance. A notable breakdown of previous support zones has occurred, suggesting that further downside movement is likely unless buyers step in with conviction. The next major support level to watch is around 1.4100, which could provide temporary relief or even trigger a short-term bounce.
The Relative Strength Index (RSI) is currently at 31.31, approaching the oversold territory (below 30). This suggests that the pair might be near a short-term exhaustion point, potentially leading to a small corrective bounce before resuming its downward movement. However, the RSI alone isn’t a sufficient reversal signal unless supported by a strong volume increase and price confirmation.
From a technical perspective, the price is trending lower, with 1.4290 now acting as a key resistance level. A failure to reclaim this zone could lead to further downside towards the 1.4100 – 1.4050 region. However, if buyers manage to push the price back above 1.4300, a short-term bullish reversal could be in play, targeting 1.4400 as the next resistance.
Overall, bearish momentum remains strong, and traders should watch for potential support reaction near 1.4100. If the price stabilizes and RSI exits oversold territory, a bounce could occur. Otherwise, a continued breakdown could lead to deeper losses, targeting levels closer to 1.4000 in the near future.
GBPJPY
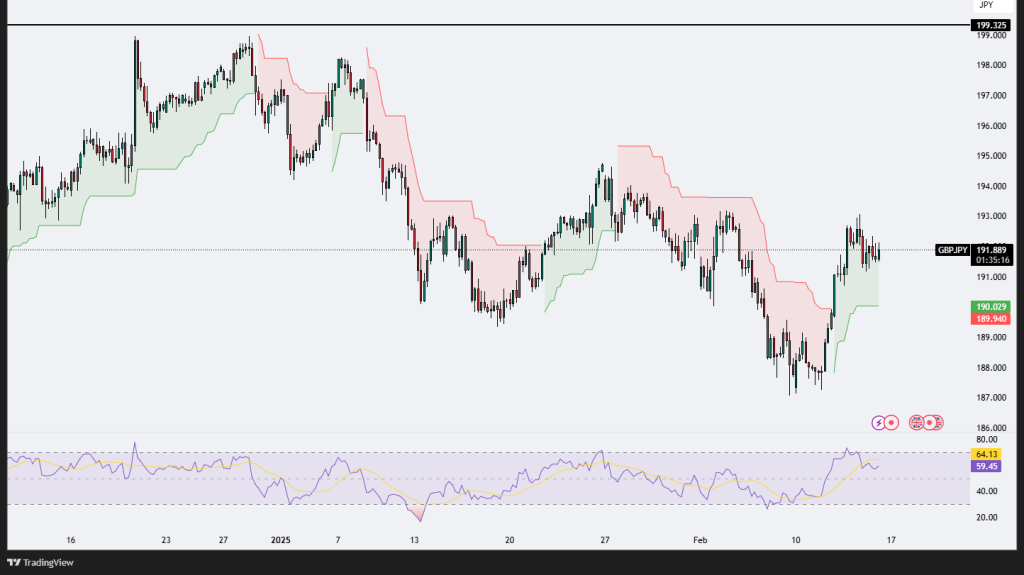
The GBPJPY chart exhibits a recovery phase following a recent downturn, with the price currently trading around 191.88. The price has bounced off the 189.00 support zone, showing renewed bullish interest. The Supertrend indicator has flipped to bullish after a prolonged bearish phase, signaling a potential trend reversal. However, the pair is now approaching a resistance area near 192.00-193.00, which may determine whether the rally continues or faces rejection.
Volume analysis indicates increasing bullish volume, suggesting that buyers are stepping in after the previous dip. This reinforces the short-term uptrend but also signals the need for a breakout above the 193.00 zone to confirm further bullish momentum. Failure to break above this resistance could lead to a pullback towards 190.00-189.00, where another support test might occur.
The Relative Strength Index (RSI) is currently at 64.13, approaching the overbought threshold but not yet signaling extreme conditions. This suggests that the rally still has room to extend further before facing exhaustion. However, if RSI crosses 70, it could indicate an overbought scenario, increasing the probability of a short-term correction.
From a technical perspective, a bullish breakout above 193.00 could lead to a push toward the next major resistance level at 195.00, where sellers may step in. On the downside, if the price fails to sustain above 190.00, it could signal a resumption of bearish pressure, leading to a test of the 188.00-187.50 range.
Overall, GBPJPY remains in a short-term uptrend, with momentum favoring buyers. However, a break above 193.00 is needed for confirmation of further upside potential. Traders should watch for volume and RSI signals to assess whether this breakout will hold or if a pullback toward 190.00 is likely before another move higher.
EURCAD
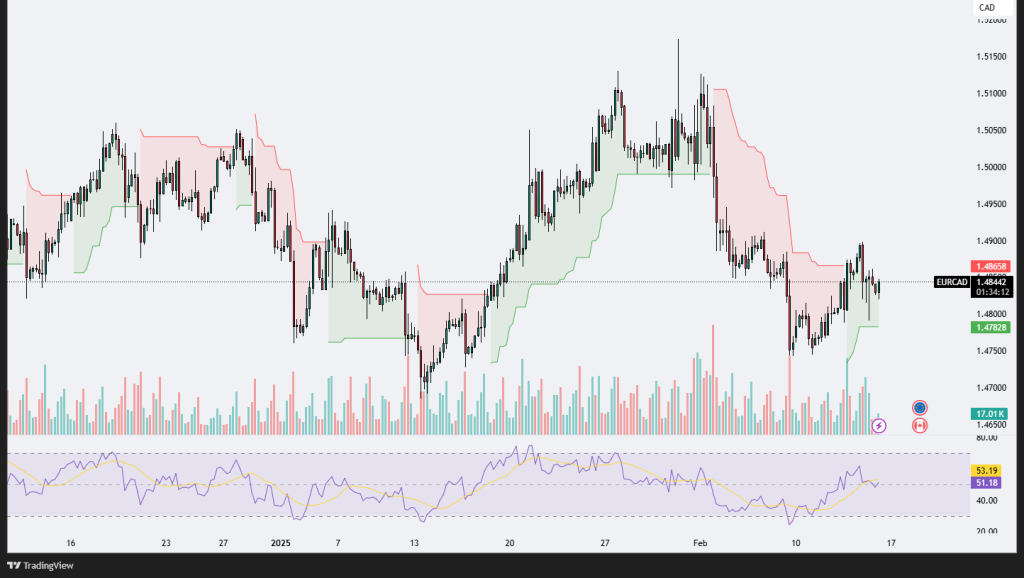
The EURCAD chart is currently displaying a potential recovery after a period of strong downward momentum. The price is trading around 1.4843, with recent bullish action pushing it higher from the 1.4750 support zone. This move suggests that buyers are trying to regain control following a sharp decline that saw the pair lose significant ground. The Supertrend indicator has flipped to bullish after being in a bearish mode, signaling a potential reversal or at least a short-term corrective rally.
However, resistance is evident near the 1.4865-1.4900 region, where sellers previously stepped in. A confirmed breakout above this area could lead to a more sustained uptrend, targeting the 1.4950-1.5000 zone, which is a key psychological and technical level. On the downside, failure to hold above 1.4800 could expose the pair to further downside pressure, with the next major support at 1.4700-1.4650.
Volume analysis shows a moderate increase in bullish activity, indicating some accumulation. However, a more decisive volume spike is needed to confirm a full-fledged trend reversal. If volume remains subdued, the price could consolidate within a range before making its next major move.
The Relative Strength Index (RSI) is currently at 51.03, signaling neutral momentum but with a slight upward bias. This suggests that the market is not overbought yet, meaning there is still room for further gains if buying interest continues. A move above 60 on the RSI could confirm bullish strength, while a drop below 45 might indicate a resumption of the previous downtrend.
Overall, EURCAD is at a pivotal level, with bullish momentum building but resistance still in play. Traders should watch for a break above 1.4900 to confirm further upside potential, while a drop below 1.4800 could lead to renewed selling pressure. Monitoring volume and RSI levels will be crucial in determining the sustainability of this current rally.


Leave A Comment