


Technical Analysis for March 7, 2025
Bitcoin (BTC/USDT) – 1H Chart
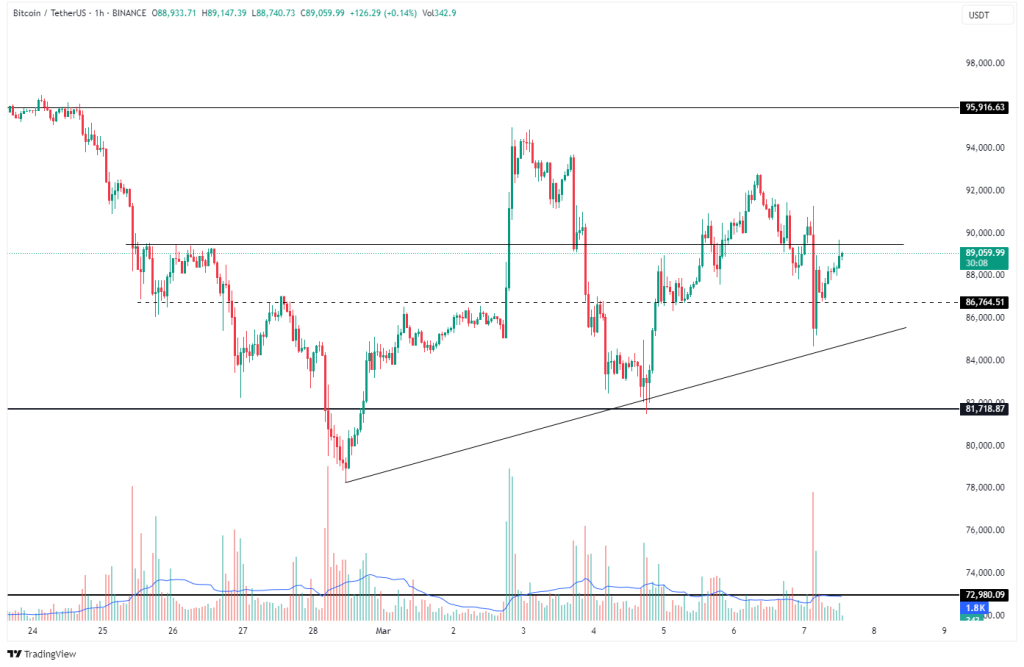
Bitcoin remains volatile, recently bouncing off the ascending trendline support near $81,700 and reclaiming the $86,700 level. The $90,000 resistance is a key hurdle, with a successful breakout potentially targeting $95,900. However, failure to hold above $86,700 could trigger a retest of the rising trendline. Volume activity suggests increasing buying pressure, but confirmation is needed.
Key Levels:
- Support: $81,700, $86,700
- Resistance: $90,000, $95,900
GBP/USD – 1D Chart
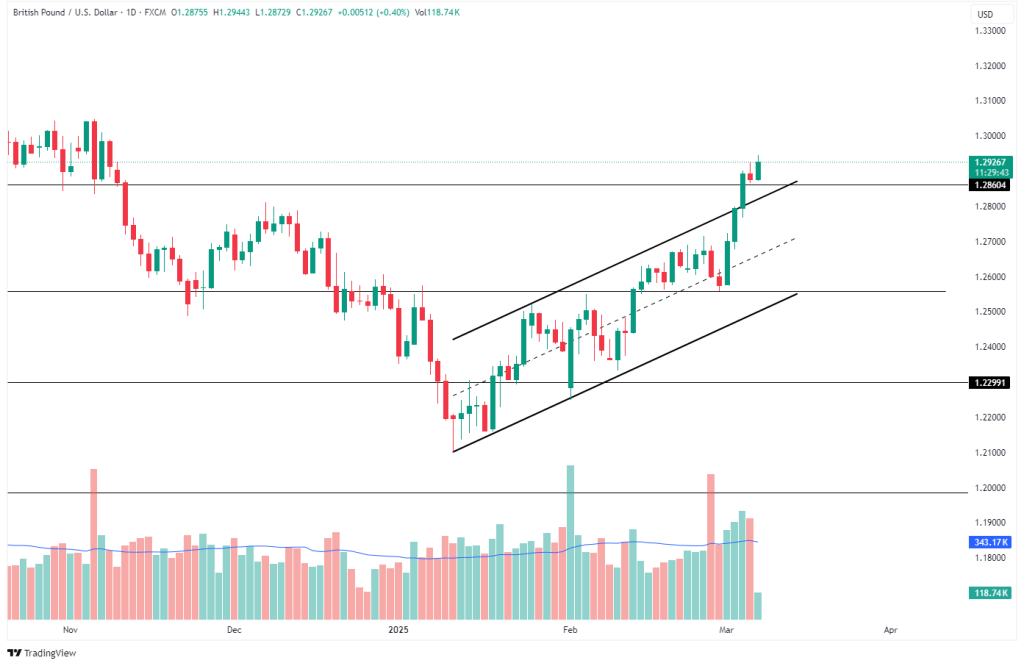
GBP/USD continues its upward trend within a rising channel, recently testing the upper boundary near 1.2926. If bullish momentum persists, a breakout could push the pair toward 1.3000+. However, failure to sustain above 1.2860 could lead to a retracement toward the lower channel trendline near 1.2600. The rising volume suggests bullish strength, but traders should watch for profit-taking.
Key Levels:
- Support: 1.2860, 1.2600
- Resistance: 1.3000, 1.3300
NVIDIA (NVDA) – 1D Chart
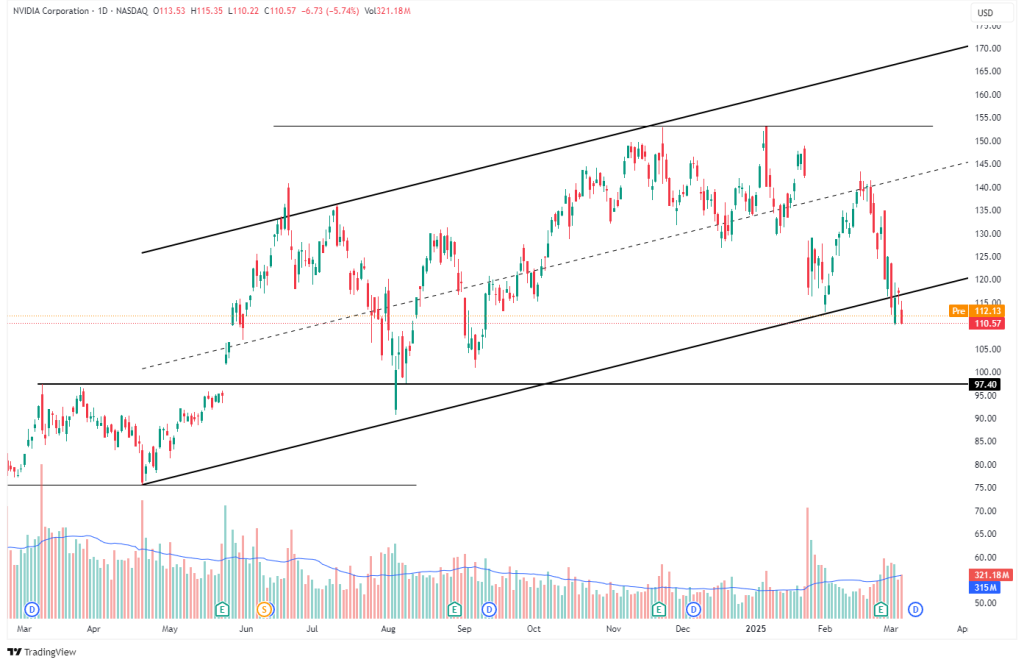
NVIDIA has tested the lower boundary of its rising channel and is currently near $110, a critical support level. A bounce from here could lead to a recovery toward $125-$130. However, if it breaks below this trendline, the next major support lies around $97.40. Given the sharp decline and strong volume spike, caution is warranted as the stock may attempt a short-term reversal before further downside.
Key Levels:
- Support: $110, $97.40
- Resistance: $125, $135
Brent Crude Oil – 1D Chart
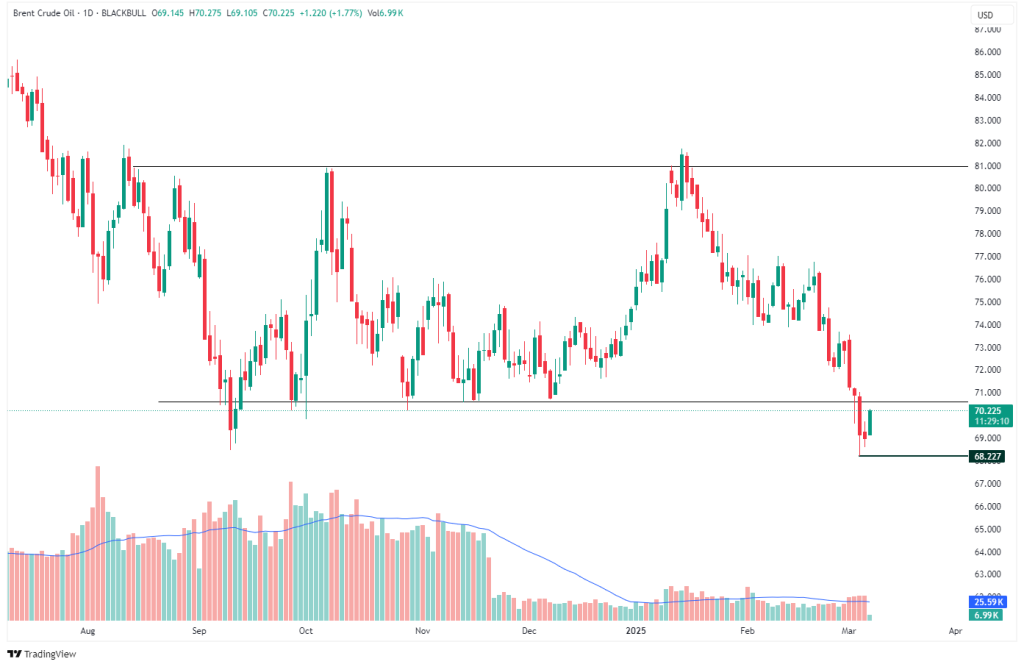
Brent crude oil has found temporary support at $68.22, rebounding toward $70.22. This level will be critical for short-term direction. If buyers hold this area, a push toward $72-$74 is possible. However, if selling pressure resumes, a break below $68 could open the door to $65. The declining volume suggests uncertainty, making upcoming macroeconomic events key to price direction.
Key Levels:
- Support: $68.22, $65.00
- Resistance: $72.00, $74.00


Leave A Comment