

EUR/USD, Silver, Copper, Apple: Range-bound movements, breakout attempts, key retests
EUR/USD Analysis
EUR/USD Retests Support Zone – Bearish Rejection in Play?
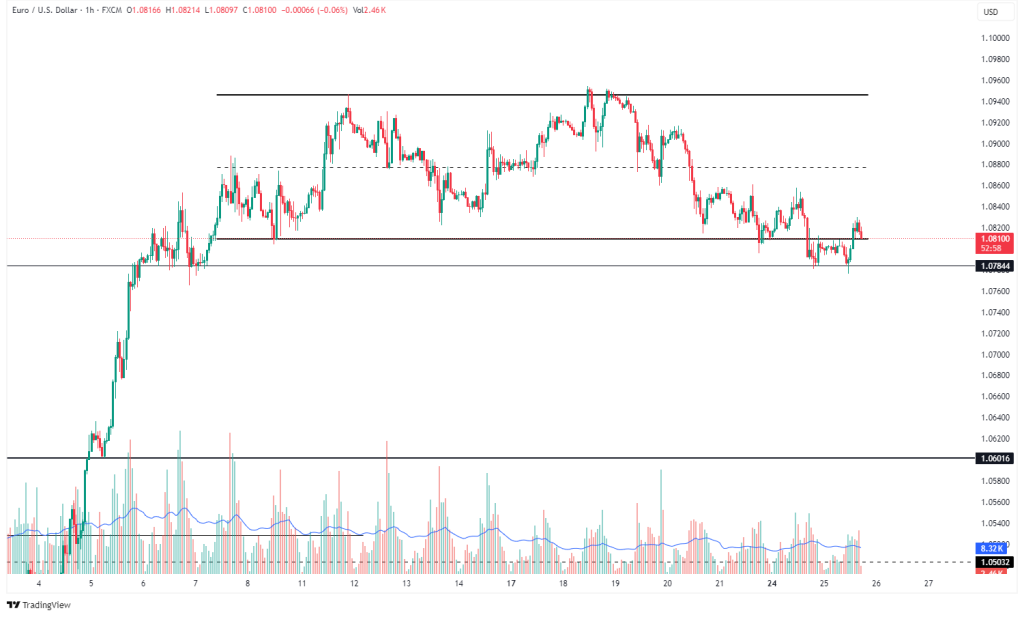
EUR/USD trades near 1.08220, testing the lower boundary of its 1.07844–1.09600 range. Failure to reclaim 1.08400 may signal further downside.
EUR/USD is currently trading around 1.08220, aligning with a previous support-turned-resistance at the 1.08400 mid-level. The pair remains inside a well-defined range between support at 1.07844 and resistance at 1.09600. Recent price action suggests a retest of the lower boundary, with a potential bearish rejection forming. If the pair fails to reclaim 1.08400, the risk of a deeper move toward the range support increases. Volume analysis shows a slight increase during the retest, signaling possible accumulation or distribution near support.
- Key Levels:
- Resistance: 1.09600
- Mid-level (former support): 1.08400
- Support: 1.07844
- Volume Analysis: Slight increase during support retest, indicating cautious accumulation or distribution.
Silver (XAG/USD) Analysis
Silver Reclaims Support and Eyes 34.08 – Momentum Builds
Silver bounces from 33.37 support and pushes toward 34.08 resistance. Bullish volume suggests buyers are in control.
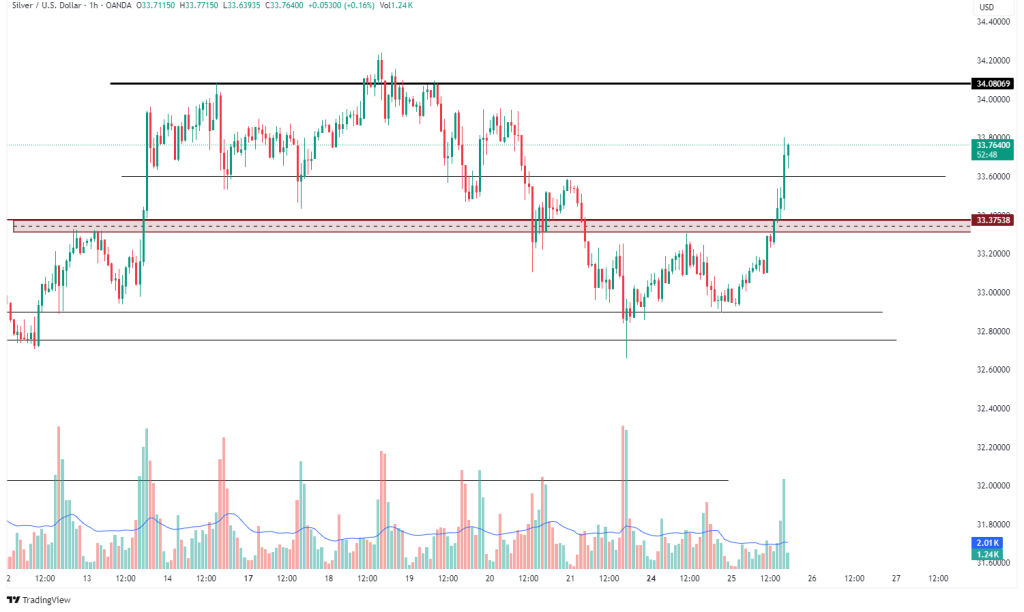
Silver (XAG/USD) rebounded after a sharp rejection near 33.00, reclaiming the 33.37 support zone, which has since held firm. Price then surged higher, breaking through minor resistance and is now approaching the previous swing high at 34.08. The recent move is backed by a notable spike in bullish volume, indicating that momentum is currently favoring buyers. As long as price holds above 33.37, attention remains on whether bulls can break through the 34.08 resistance level.
- Key Levels:
- Support: 33.37 (retested and held)
- Resistance: 34.08
Copper (CFDs) Analysis
Copper Retests Highs at 5.2070 – Will the Uptrend Continue?
Copper tests the previous high at 5.2070. A breakout signals further upside, while rejection may lead to a pullback toward 5.0975 support.
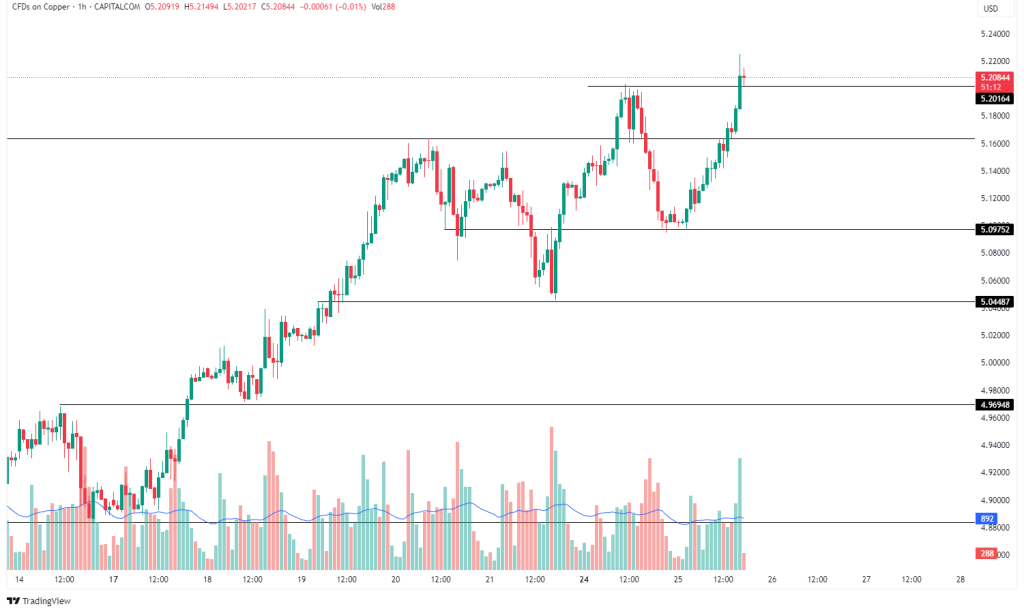
Copper remains in a strong uptrend, currently testing the previous high near 5.2070. A clean breakout above this level would confirm trend continuation into new highs, signaling strong bullish momentum. However, if the price fails to break through, a pullback toward support at 5.0975 could unfold. The overall structure shows a pattern of higher highs and higher lows, supported by rising volume during bullish impulse moves, reinforcing the strength of the current trend.
- Key Levels:
- Immediate Resistance: 5.2070
- Support: 5.0975 – 5.0448
Apple Inc. (AAPL) Analysis
Sharp Rebound from $215 Demand Zone – Eyes on $235 Resistance
Price bounces from $213–$217 demand zone with rising volume. A move toward $235 may suggest mid-term reversal potential.
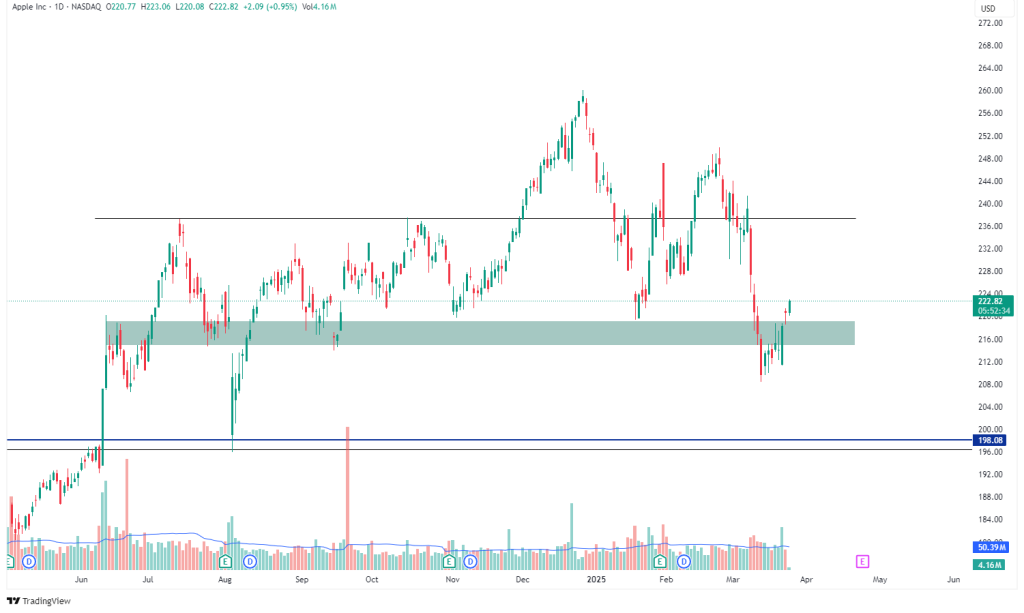
Price has rebounded sharply from a key demand zone between $213 and $217, where previous accumulation occurred. This area once again showed strong buyer interest, with a noticeable volume uptick suggesting potential institutional activity. The asset is now pushing toward resistance at $235, which could serve as a barrier or breakout point for a mid-term reversal if momentum continues. Below, $198 remains a major support to watch in case of a pullback.
- Key Levels:
- Demand Zone: $213–$217
- Resistance: $235
- Major Support: $198
- Volume Analysis: Noticeable uptick as price hit the demand zone, hinting at institutional buying.
.png)

.png)


