

Markets at Key Turning Points: Forex, Equities, and Commodities in Focus
USD/JPY (First Chart)
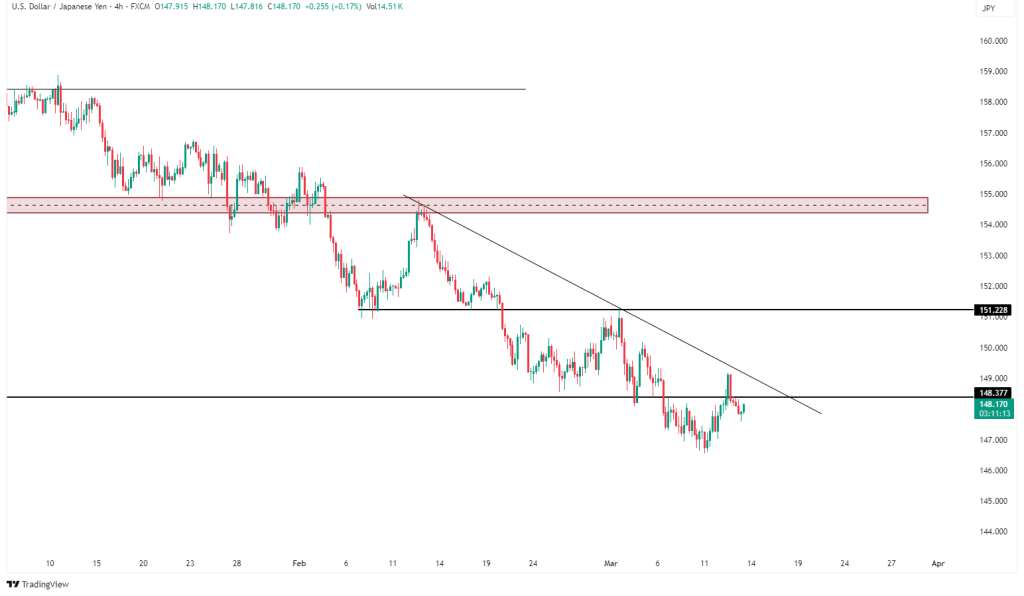
USD/JPY Battles Resistance – Breakout or Rejection?
USD/JPY tests 148.377 resistance. A breakout may push it to 151.228, while failure could see a drop toward 145.000. BOJ policy & U.S. inflation in focus!
USD/JPY is making an attempt to break the descending trendline, but strong resistance at 148.377 is limiting further upside. A successful breakout above this level could trigger a bullish push toward the next key resistance at 151.228. However, if the price fails to sustain above the trendline, downward momentum may resume, potentially testing lower support around 145.000. The yen’s performance remains highly sensitive to Bank of Japan’s upcoming policy decisions and U.S. inflation expectations, both of which could shape the pair’s next major move.
KEY LEVELS: 148.377 (resistance), 151.228 (next major resistance), 145.000 (potential support)
EU Stocks 50 (Second Chart)
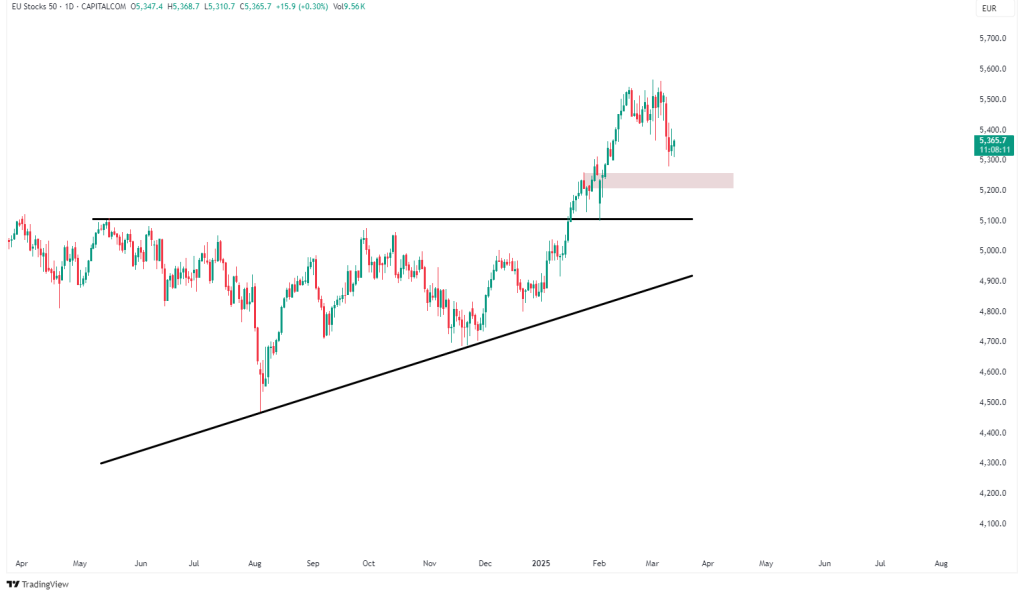
Euro Stoxx 50 Holds Strong – New Highs Ahead?
Euro Stoxx 50 tests support after an ascending triangle breakout. Holding above 5300-5350 could target 5500, while a breakdown may signal a retracement.
The Euro Stoxx 50 remains in a strong uptrend, having recently broken out from a long-term ascending triangle pattern. After a slight pullback, the index is now testing its previous breakout levels as support. If this area (5300-5350) holds, the bullish trend could continue, aiming for the next key resistance at 5500. However, a breakdown below this range might push the index back into its previous consolidation phase. Market direction will heavily depend on ECB policy decisions and global risk sentiment, both of which could influence momentum in the coming sessions.
KEY LEVELS: 5300-5350 (support), 5500 (next resistance)
Natural Gas (Third Chart)
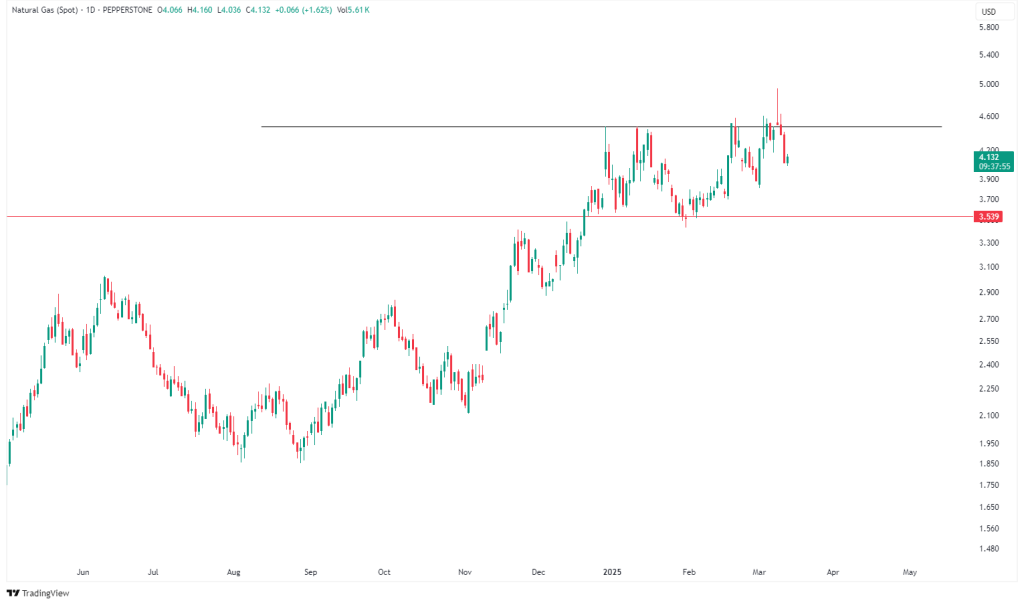
Natural Gas Holds Uptrend – Breakout or Reversal?
Natural gas trades in a rising channel, testing support at $3.80. A rebound could target $4.50, while a breakdown may signal trend reversal. Watch key levels!
Natural gas continues to trade within a rising channel, maintaining a clear uptrend. Recently, the price pulled back to channel support at $3.80, a crucial level for short-term direction. If this support holds, another move toward the upper boundary at $4.50 is likely. However, a break below $3.80 could signal a potential trend reversal, shifting momentum to the downside. Traders should monitor confirmation signals before positioning. Supply and demand factors, weather patterns, and geopolitical risks remain key influences on future price action.
KEY LEVELS: 3.80 (channel support), 4.50 (channel resistance)
Silver (Fourth Chart)
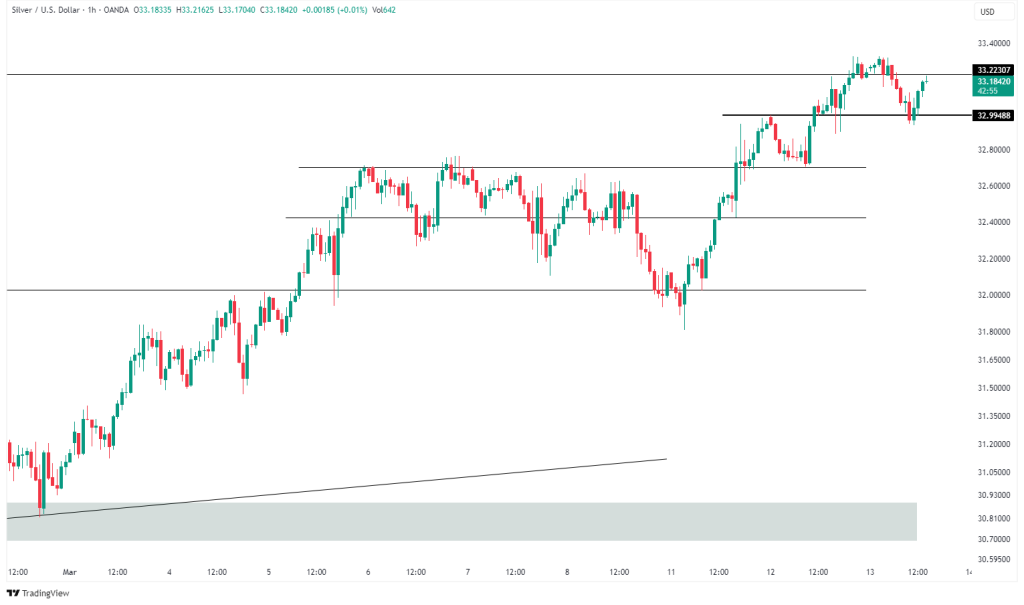
Silver Stays Strong – Can Bulls Push Higher?
Silver holds bullish momentum after rebounding from $32.99 support. A move above $33.22 could extend gains, while failure may lead to a retracement.
Silver continues to exhibit strong bullish momentum, forming higher highs and higher lows. The price recently tested support at $32.99 and rebounded, signaling ongoing strength. If silver sustains above this level, the next upside target is $33.22, with potential for further gains. However, a failure to hold support could trigger a deeper retracement. Inflation concerns and upcoming Federal Reserve rate decisions will be key factors influencing silver’s trend in the short term.
KEY LEVELS: 32.99 (support), 33.22 (resistance)
.png)

.png)


