

Gold & Bitcoin at Key Levels: Breakout or Rejection Ahead?
Gold at a Crossroads: Will XAUUSD Break $2,876 or Face a Pullback?
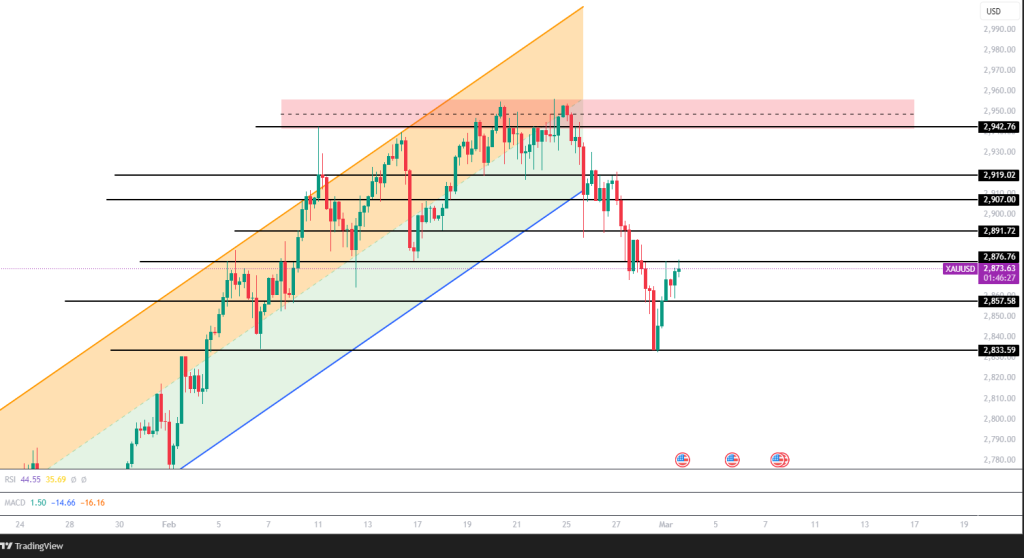
Since December 2024, gold (XAU) has been in a strong uptrend, reaching an impressive high of $2,955 on February 24, 2025. However, following this peak, the market experienced a sharp pullback, leading to a period of correction. The price found support around the $2,833 level, where buyers stepped in to prevent further declines.
Currently, XAU is trading at $2,874, approaching the $2,876 resistance level. This level is crucial in determining the next directional move. If the price fails to break above $2,876, it could indicate continued selling pressure, leading to further downside movement. In this scenario, we could see gold retreat towards the next support levels at $2,857 and $2,833, where buying interest might resurface.
On the other hand, if gold manages to break and hold above the $2,876 resistance level, bullish momentum could strengthen. In this case, the next key resistance levels to watch would be $2,891 and $2,907. A sustained move above these levels could pave the way for further gains and a potential retest of the recent highs.
Traders and investors should closely monitor price action around these key levels, as they will provide important clues regarding the short-term trend. Additionally, macroeconomic factors, interest rate expectations, and market sentiment will likely play a significant role in determining gold’s next move.
Bitcoin Battles Resistance: Can Bulls Break the $96K Barrier?
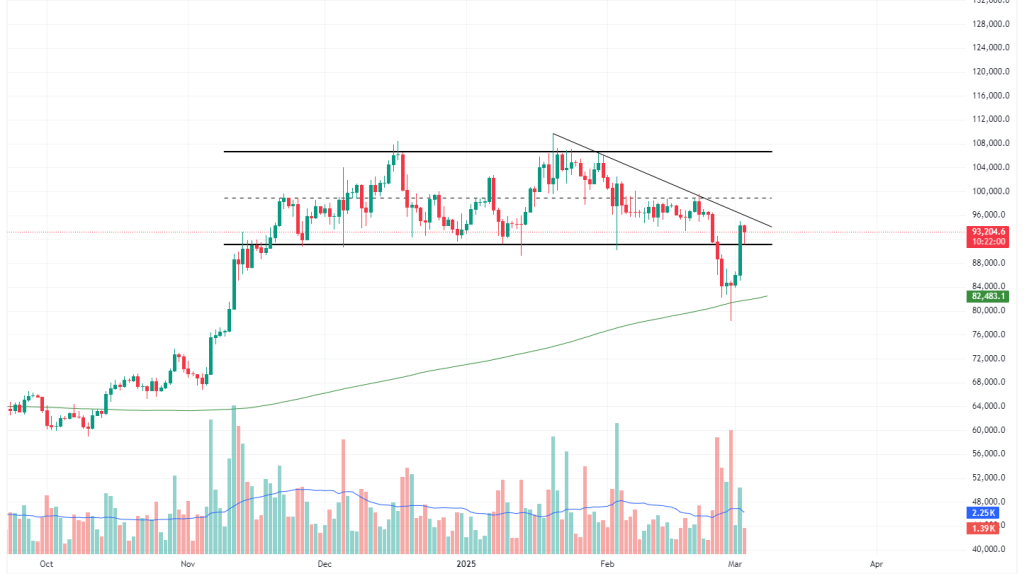
Bitcoin has recently rebounded from the 200-day moving average (SMA-200), currently positioned around $82,483, indicating that buyers have stepped in at this critical support level. This bounce has allowed BTC to regain some lost ground and move back into its previous horizontal trading range.
However, despite this upward reaction, BTC remains within a descending trendline that has been acting as dynamic resistance since its all-time high in late December 2024. The latest attempt to break above this trendline was met with selling pressure, preventing a clear bullish breakout.
Currently, BTC is trading around $93,180, facing resistance just below $96,000. If bulls fail to push the price above this descending resistance zone, a rejection could lead to another decline towards the $88,000 support region. This level has acted as a key pivot point in previous trading sessions, and a break below it could expose BTC to further downside risks.
Key Levels to Watch:
🔹 Support Levels: $88,000 – $84,000 – $82,483 (200-SMA)
🔹 Resistance Levels: $96,000 – $97,500 – $100,000
Potential Scenarios:
Bearish Scenario: If BTC fails to break above the descending trendline and faces rejection near $96,000–$97,500, it may retrace back to $88,000, with $84,000 and the 200-SMA ($82,483) as the next key support levels.
Bullish Scenario: If BTC can successfully break and hold above $97,500, this could invalidate the descending trend structure and signal a potential continuation toward $100,000 and above.
Bitcoin is at a critical decision point. The descending trendline remains a major obstacle, while the 200-day SMA has provided strong support. If BTC can break above $97,500, bullish momentum could accelerate, targeting the psychological $100,000 mark. However, a rejection could lead to another retest of the $88,000 region in the short term.
Traders should watch for volume confirmations and price action reactions at these key levels to determine BTC’s next major move.
.png)

.png)


