

Technical Analysis 03.10.2024
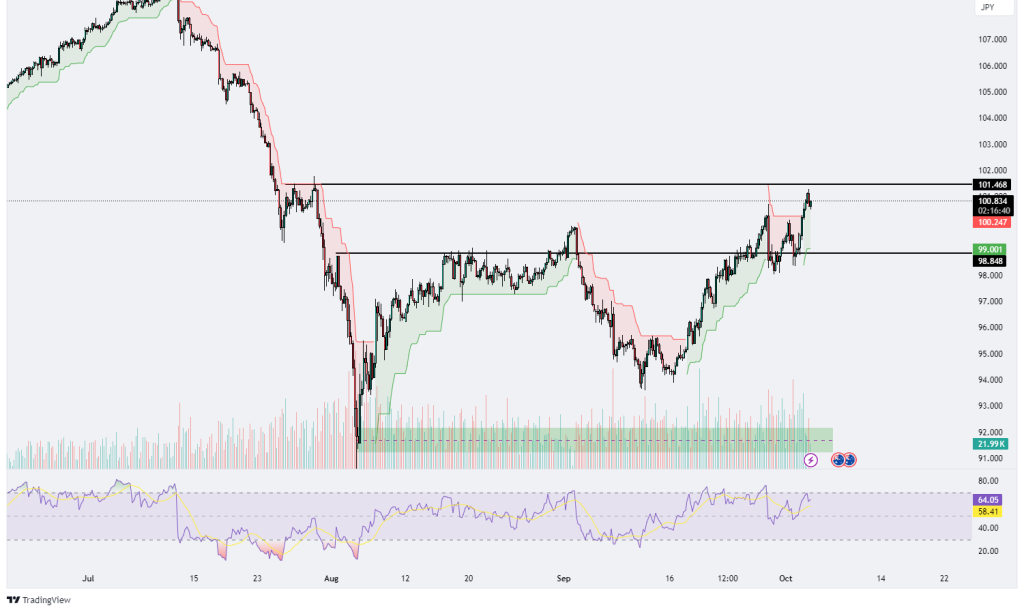
AUDJPY
The AUD/JPY pair is currently trading near resistance levels across multiple time frames, as indicated by the Supertrend values on the 4-hour, 1-hour, and 15-minute charts. The 4-hour chart shows a support at 98.971 and resistance at 100.813, with an RSI of 63.79, suggesting that the pair is approaching overbought conditions and may face a potential pullback. On the 1-hour chart, the RSI is at a more neutral 61.36, and price action is similarly close to the resistance level of 100.813, making the direction uncertain. The 15-minute chart also reveals resistance at 100.954 and a neutral RSI of 54.34. If the price manages to break above these resistance levels in the shorter time frames, the pair could see further bullish momentum. However, the RSI values across all time frames are either near the overbought zone or neutral, which indicates the potential for a reversal if the resistance holds. Overall, a breakout could signal continued upside, while failure to breach resistance might result in a retracement.
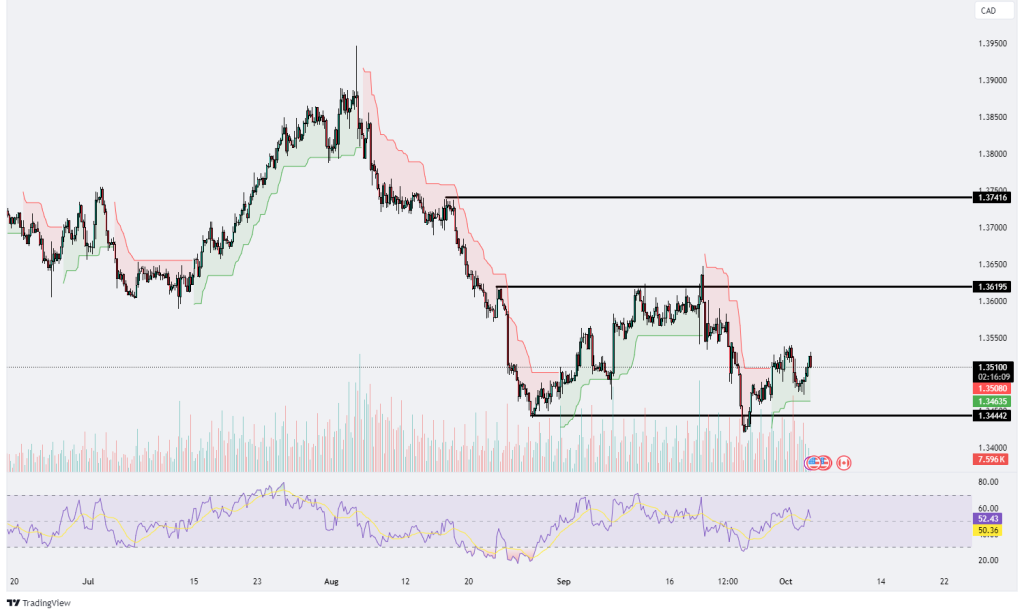
USDCAD
The USD/CAD pair is trading near key resistance levels across multiple time frames, as indicated by the Supertrend values on the 4-hour, 1-hour, and 15-minute charts. On the 4-hour chart, the pair has support at 1.34609 and resistance at 1.35089, with a neutral RSI reading of 52.36, suggesting indecisiveness in the price action. Similarly, on the 1-hour chart, the RSI is slightly higher at 53.87, and the price is again close to the resistance at 1.35089, indicating uncertainty regarding the next move. However, the 15-minute chart presents a slightly different picture, showing a higher resistance at 1.35283 and an RSI of 38.19, which is close to the oversold region, signaling a possible short-term rebound if buying pressure increases. Overall, the USD/CAD is at a critical juncture: a breakout above resistance could trigger further bullish momentum, while a rejection could lead to a potential pullback or consolidation.
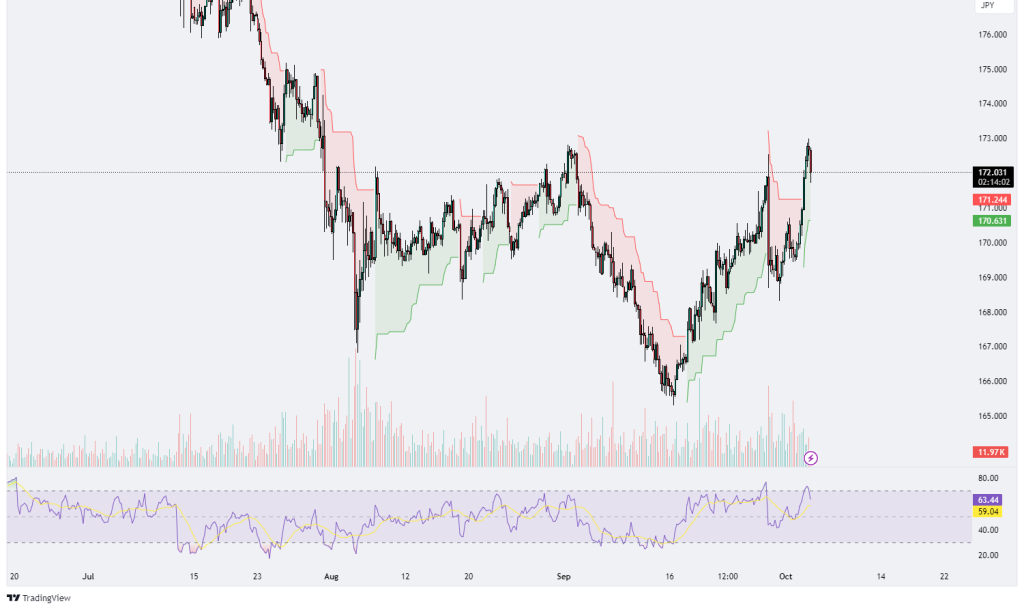
CHFJPY
The CHF/JPY pair is trading near resistance levels across multiple time frames, as shown by the Supertrend values on the 4-hour, 1-hour, and 15-minute charts. On the 4-hour chart, the pair has support at 170.556 and resistance at 171.981, with the RSI at 62.79, approaching the overbought zone, indicating a potential pullback. The 1-hour chart shows a support at 171.769 and the same resistance at 171.981, with a neutral RSI of 54.38, suggesting indecisiveness in the short term. Meanwhile, the 15-minute chart indicates a higher resistance at 172.579 and an oversold RSI of 27.85, which could signal a short-term bounce if buying pressure increases. Overall, the CHF/JPY is at a critical point: a breakout above resistance could lead to further bullish momentum, while a failure to breach resistance might trigger a pullback or consolidation.
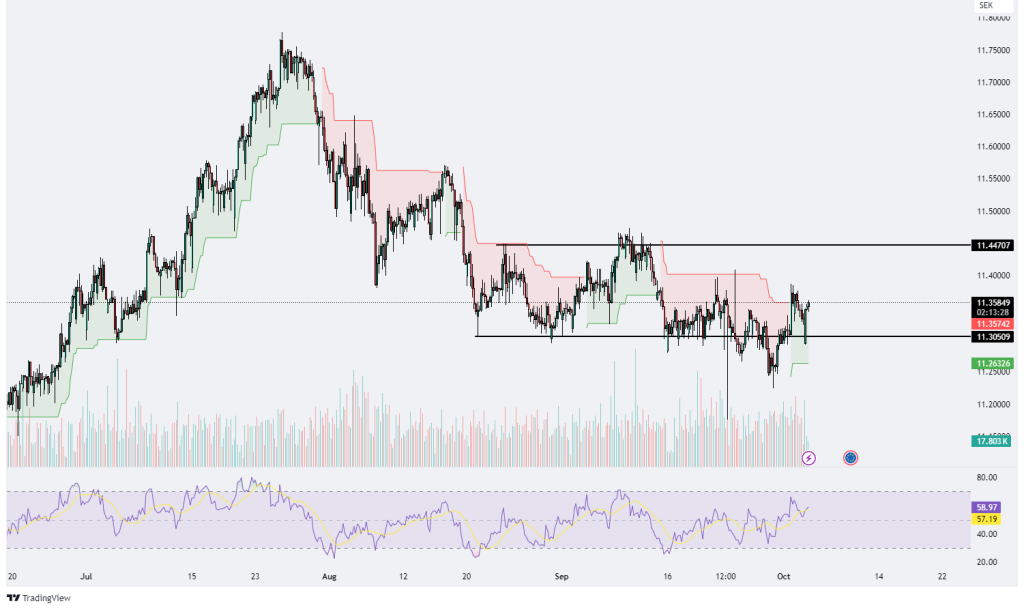
EURSEK
The EUR/SEK pair is trading near key resistance levels across multiple time frames, as indicated by the Supertrend values on the 4-hour, 1-hour, and 15-minute charts. On the 4-hour chart, support is at 11.26623 and resistance at 11.35958, with a neutral RSI of 57.50, suggesting a lack of clear direction. Similarly, on the 1-hour chart, the pair shows support at 11.32550 and the same resistance at 11.35958, with an RSI of 61.58, which still indicates indecisiveness. However, on the 15-minute chart, resistance remains at 11.35958, but the RSI is at 63.16, approaching the overbought zone, which could signal a potential pullback in the very short term. Overall, if the pair manages to break above the resistance in any time frame, it could trigger further bullish momentum, but failure to breach resistance may result in a short-term pullback or consolidation.
.png)

.png)


