

Market Volatility: Gold Surges, Nasdaq & Nvidia Drop, USD Weakens
Technical Analysis
Gold (XAU/USD)
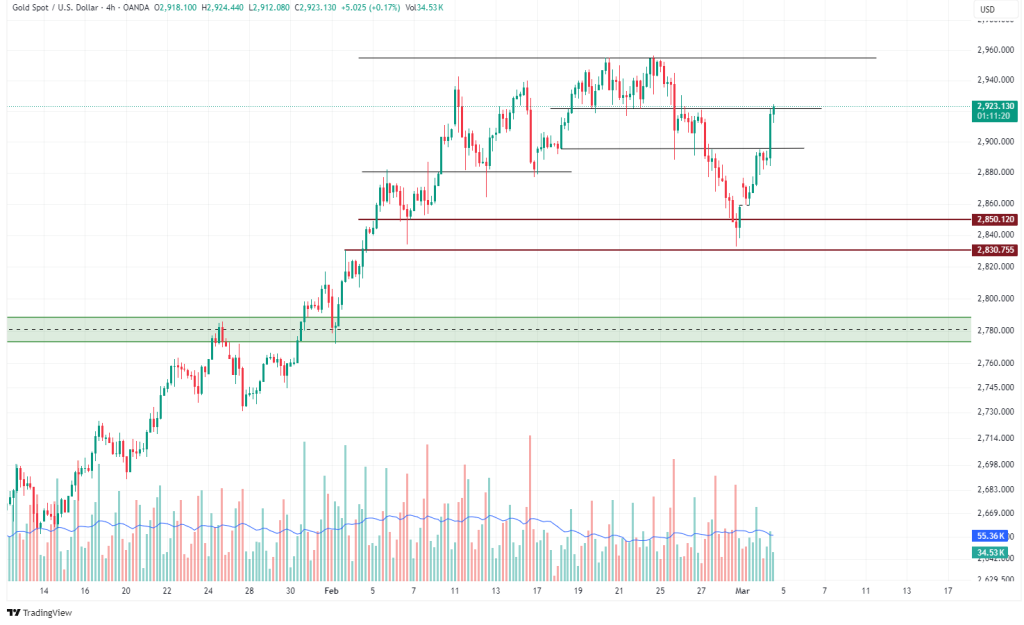
Gold surged past $2,900 amid rising geopolitical tensions and economic uncertainty. The key resistance level is now at $2,950, with a potential breakout leading to $3,000. Support is seen at $2,880, where buyers may step in. The RSI remains in overbought territory, indicating potential consolidation before the next leg up.
The attached chart indicates a key rejection from the previous resistance zone, with price action showing strong bullish momentum. If gold breaks above $2,950, the next target would be around $2,980-$3,000. However, failure to hold above $2,900 could lead to a retest of $2,850 support.
U.S. Dollar Index (DXY)
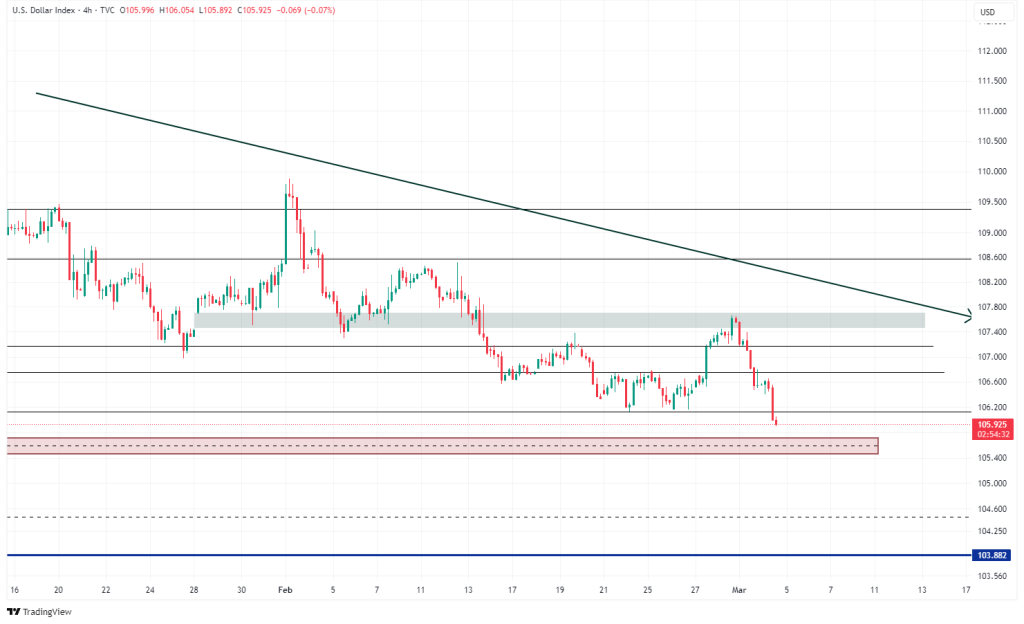
The dollar index fell sharply following the tariff announcement, breaking below the key 102 support level. If selling pressure continues, the next support lies at 101.5, with further downside toward 100. Resistance is now at 102.5, where any recovery attempts may be capped by ongoing market uncertainty.
Technical indicators show a strong downtrend, with the DXY testing a major demand zone around 105.50. A breakdown from this level could accelerate losses toward 104.80. However, any short-term bounce might test the descending resistance trendline near 107 before further downside continuation.
Nasdaq 100 (NDX)
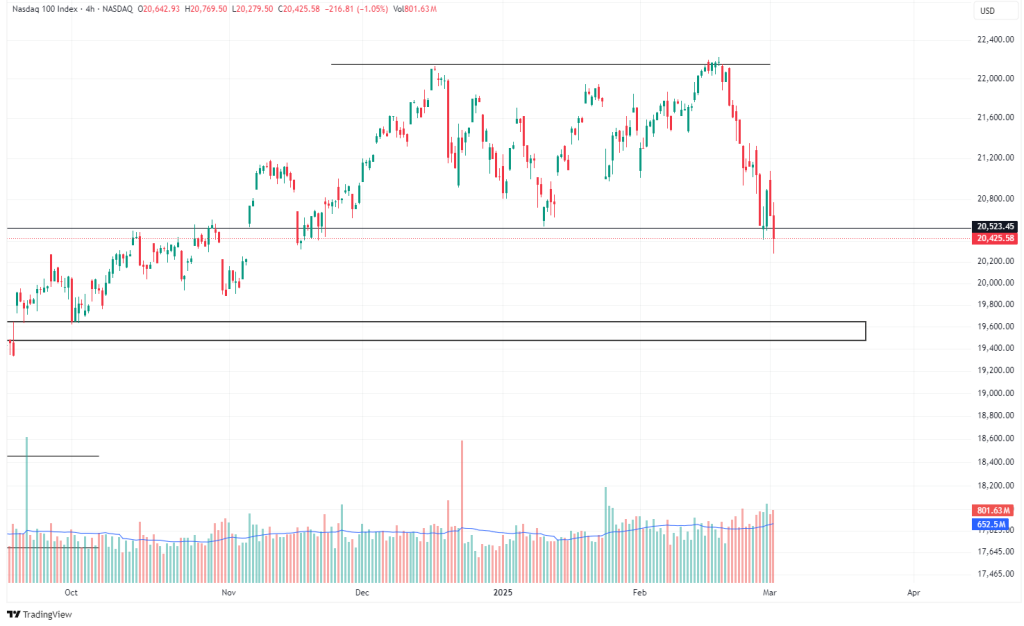
The Nasdaq experienced a steep decline, breaking below the 15,500 support level. The next key support is at 15,200, with a further drop possibly testing 15,000. On the upside, resistance is seen at 15,800. The MACD suggests bearish momentum, and the RSI is approaching oversold territory, which could signal a short-term rebound.
The attached chart indicates that Nasdaq is testing critical support around 20,400. A breakdown could trigger a decline toward 19,700, a major demand zone. If a rebound occurs, resistance is expected at 21,000, with stronger selling pressure near 21,500.
Nvidia (NVDA)
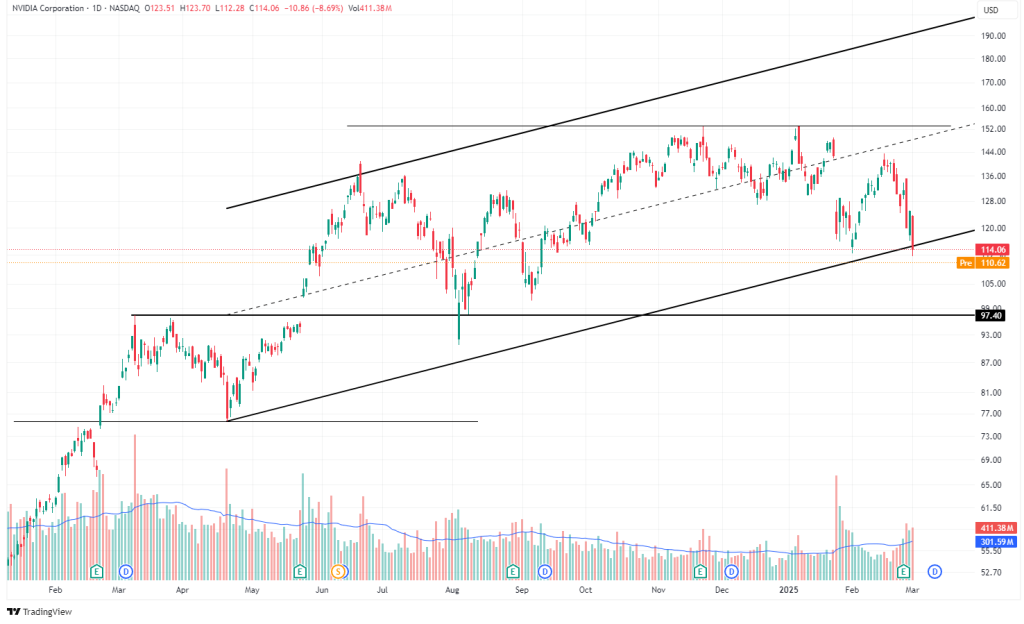
Nvidia suffered an 8% decline, breaking below key support at $750. The next critical support is at $720, with a potential move lower toward $700. Resistance is at $780, where sellers may emerge. The stock’s 50-day moving average has flattened, indicating a possible trend reversal if downward pressure persists.
The Nvidia chart shows that price is testing the lower boundary of the long-term ascending channel. If support near $110 holds, a recovery toward $125 is possible. However, a breakdown could accelerate losses toward $97, a major historical support level.
Other US Indices
S&P 500 (SPX)
The S&P 500 dropped sharply, breaching the 4,900 support level. The next major support stands at 4,850, with a further decline potentially testing 4,800. Resistance is at 4,950, with sellers likely to emerge at this level. The RSI is moving toward oversold territory, suggesting a potential short-term bounce.
Dow Jones Industrial Average (DJI)
The Dow Jones broke below 38,000, signaling a shift in market sentiment. The next key support is at 37,500, with further downside risks if bearish momentum continues. Resistance lies at 38,200, which could limit any upward correction. The MACD suggests increasing downward pressure, while the RSI is near oversold levels.
With a volatile week ahead, market participants will need to navigate through a mix of political developments, macroeconomic indicators, and central bank decisions. Risk management strategies will be crucial as uncertainty remains the prevailing theme across financial markets.
.png)

.png)


