

Technical Analysis 04.10.2024
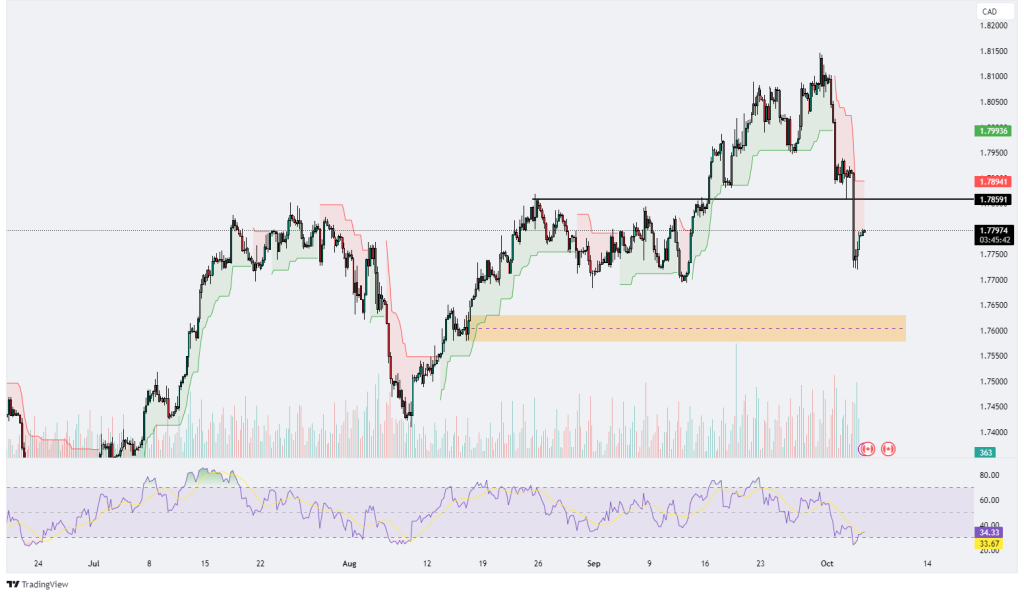
GBPCAD
The GBP/CAD pair is currently exhibiting a downward trend across the 15-minute, 1-hour, and 4-hour timeframes. In the 15-minute chart, the volume indicator has shown an increase, while the RSI is at 60.28, close to the overbought region. The Supertrend indicator is at 1.77824, above the price, signaling a bearish trend. On the 4-hour chart, the volume indicator has not displayed a significant rise, and the RSI stands at 34.93, nearing the oversold territory. The Supertrend level is at 1.78918, also indicating a downtrend. Similarly, the 1-hour chart shows increased volume, with the RSI at 47.55, reflecting a neutral stance, and the Supertrend at 1.78191 above the price, confirming the bearish outlook. Overall, the GBP/CAD pair maintains a bearish trend across all observed timeframes, with RSI levels varying between neutral and overbought in shorter timeframes and nearing oversold in the longer timeframe, while volume has shown an uptick recently.
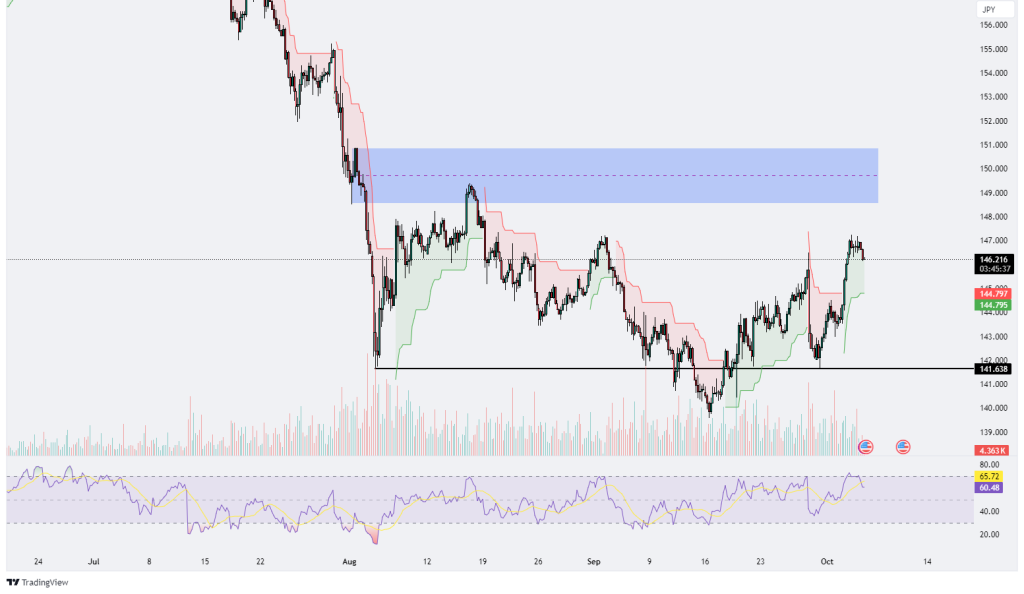
USDJPY
The USD/JPY pair displays a mixed trend across different timeframes. In the 15-minute chart, the volume indicator has increased, with the RSI at 25.15, indicating an oversold condition. The Supertrend is positioned at 146.496, above the price, signaling a bearish trend. In contrast, the 4-hour chart shows the volume indicator has not demonstrated a significant increase, while the RSI is at 60.42, approaching the overbought territory. The Supertrend in this timeframe is at 144.795, suggesting a bullish trend. Meanwhile, the 1-hour chart reflects an increase in volume, with the RSI at 40.96, indicating a neutral position, and the Supertrend at 146.107, also above the price, confirming the bearish outlook. Overall, the USD/JPY pair is experiencing a downward trend in the 15-minute and 1-hour timeframes, while the 4-hour timeframe shows signs of an upward trend, with RSI levels indicating oversold in the shorter timeframe, neutral in the 1-hour, and near overbought in the longer timeframe. Volume indicators have shown a recent increase across the observed periods.
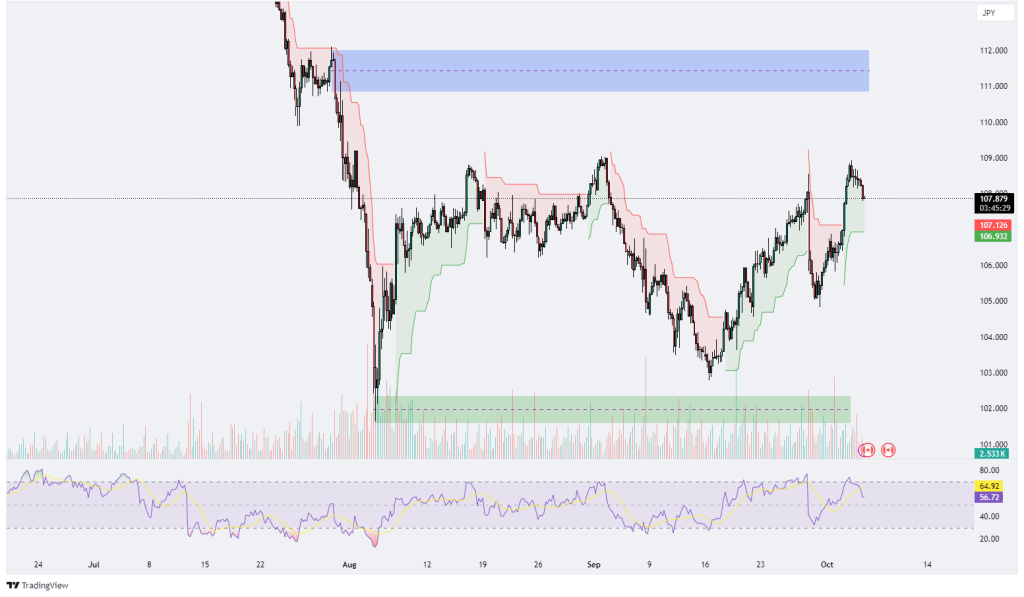
CADJPY
The CAD/JPY pair shows a mixed trend across various timeframes. In the 15-minute chart, the volume indicator has increased, with the RSI at 25.78, indicating an oversold condition. The Supertrend is at 108.091, above the price, signaling a bearish trend. In the 4-hour timeframe, the volume indicator has not exhibited a significant increase, while the RSI is at 56.30, reflecting a neutral position. The Supertrend in this timeframe is at 106.932, indicating a bullish trend. Conversely, the 1-hour chart displays an increased volume, with the RSI at 37.66, nearing the oversold region, and the Supertrend at 108.410, also above the price, confirming the bearish outlook. Overall, the CAD/JPY pair is experiencing a downward trend in the 15-minute and 1-hour timeframes, while the 4-hour timeframe reveals signs of an upward trend. RSI levels indicate oversold conditions in the shorter timeframes and a neutral position in the longer timeframe, with recent increases in volume across all observed periods.
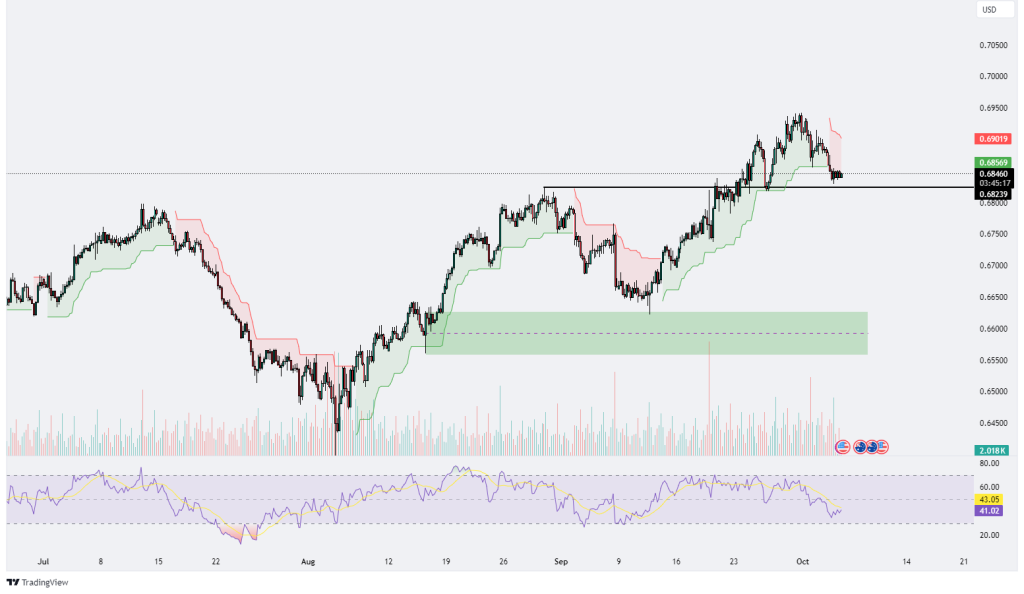
AUDUSD
The AUD/USD pair is currently experiencing a downward trend across the 4-hour, 1-hour, and 15-minute timeframes. In the 4-hour chart, the volume indicator has not shown a significant increase, with the RSI at 41.38, indicating a neutral position. The Supertrend is at 0.69023, positioned above the price, signaling a bearish trend. In the 15-minute timeframe, the volume indicator has recently increased, while the RSI stands at 52.04, also reflecting a neutral stance. The Supertrend in this timeframe is at 0.68546, indicating a continued bearish outlook. The 1-hour chart shows no significant change in volume, with the RSI at 46.11, remaining in the neutral zone, and the Supertrend at 0.68922, further confirming the downward trend. Overall, the AUD/USD pair is maintaining a bearish trend across all observed timeframes, with RSI values consistently in the neutral region and a notable increase in volume only in the 15-minute timeframe.
.png)

.png)


