

Technical Analysis 04.12.2024
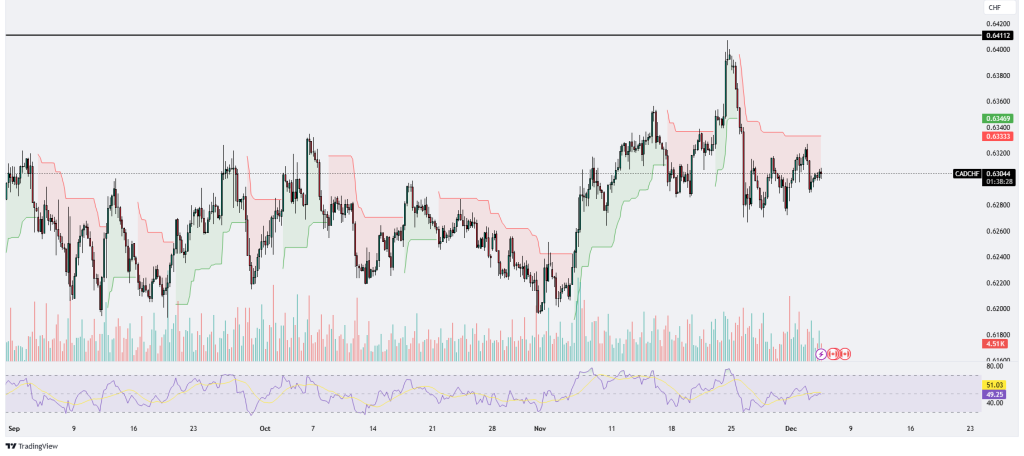
CADCHF
The CAD/CHF chart presents a mixed picture with a lack of strong directional movement, as evidenced by the price oscillating within a range and struggling to establish a clear trend. The Ichimoku cloud analysis shows that the price has frequently moved in and out of the cloud, reflecting indecision in the market. Currently, the price hovers near the lower boundary of the red cloud, suggesting bearish pressure; however, it is also not far from breaking above resistance at 0.6345, which could open doors to higher levels.
The RSI indicator remains relatively neutral around the 50 level, further confirming the lack of momentum in either direction. The RSI suggests neither overbought nor oversold conditions, indicating that traders are waiting for a catalyst to determine the next significant move. Volume appears subdued, adding to the market’s indecisiveness, with no significant spike to suggest a strong interest in either buying or selling.
On the upside, a break above the resistance at 0.6345 could lead to a test of the next major resistance level around 0.6411, which has previously acted as a ceiling for bullish moves. Conversely, failure to maintain current levels and a break below the recent low near 0.6280 could push the pair toward further bearish territory, with 0.6220 as a possible target. Overall, the pair is in a consolidation phase, and traders should monitor key levels closely for a breakout or breakdown to capitalize on the next trend.
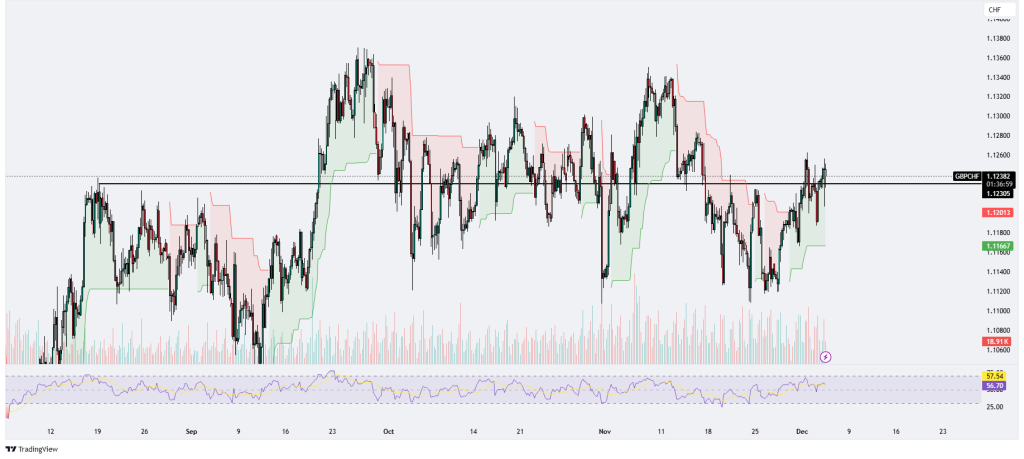
GBPCHF
The GBP/CHF chart displays a consolidation phase with potential for a breakout. Price action has recently breached the 1.1200 resistance level, now acting as support, suggesting a bullish bias. The Ichimoku cloud analysis shows the price hovering near the upper boundary of the cloud, indicating increasing bullish momentum. However, the multiple wicks around the resistance at 1.1230 suggest some hesitation, and a clear breakout above this level is needed for further upside confirmation.
The RSI indicator, currently around 57, supports the bullish narrative, as it is trending upwards but not yet overbought, leaving room for further gains. The overall volume shows a slight uptick, which may indicate growing interest from buyers. However, sustained volume is crucial for any significant move above the immediate resistance zone.
If the price manages to close above 1.1230, the next potential target could be the 1.1300 area, which aligns with previous swing highs. On the downside, failure to hold above 1.1200 could see a retest of the 1.1160 support level, with further losses opening the door to 1.1100. Traders should monitor volume and price action closely for confirmation of a breakout or potential reversal within this consolidation range.
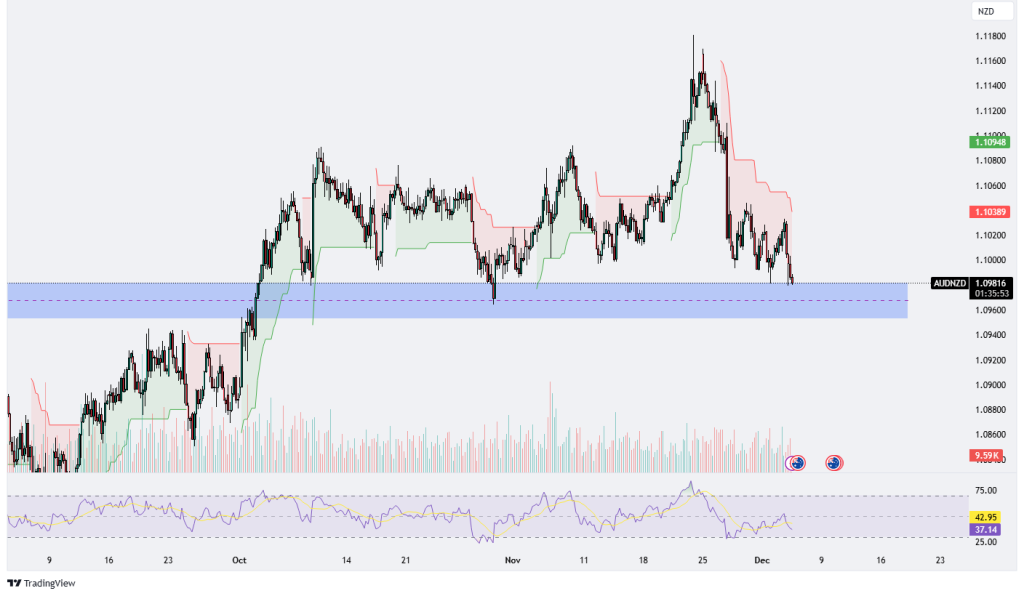
AUDNZD
The AUD/NZD chart indicates that the price is currently testing a key horizontal support zone around the 1.0980–1.0960 level, highlighted by the blue shaded area. This support region has acted as a strong demand zone in the past, leading to significant bullish rebounds, as seen in prior price movements. The Ichimoku cloud analysis suggests bearish momentum as the price is trading below the cloud, but the proximity to support could lead to a potential reversal if buyers step in.
The RSI is trending near oversold territory, currently around 37, indicating bearish momentum is losing steam and hinting at a possible bounce from the support zone. However, the volume profile shows increased activity during the recent downward move, reflecting strong selling pressure. For a bullish reversal to gain traction, the price needs to hold above this critical support zone and break above immediate resistance at 1.1030.
If the price fails to maintain the support, the next downside target could be the psychological 1.0900 level. Conversely, a successful rebound could see the price aiming for the 1.1090–1.1110 resistance area. Traders should monitor volume and RSI closely for early signs of a reversal or a continuation of the downtrend.
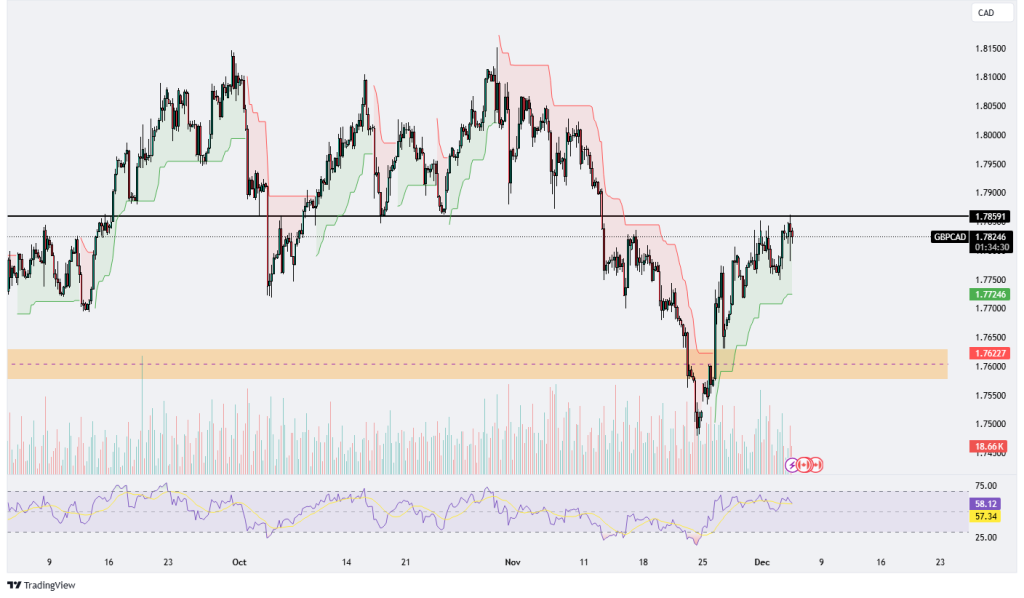
GBPCAD
The GBP/CAD chart shows a strong recovery from the support zone around 1.7622, as indicated by the orange shaded area, which has acted as a key demand zone in the past. The price is currently approaching a significant resistance level at 1.7859. This level has previously acted as a barrier to upward momentum, and its proximity makes it a critical area to watch for potential price action developments.
The recent bullish momentum is supported by a steady rise in RSI, currently in the 57–58 range, indicating improving buying pressure but not yet overbought. The Ichimoku cloud analysis suggests bullish sentiment as the price is trading above the green cloud, with a clear breakout from prior consolidation. However, the volume profile shows a slight decrease, suggesting waning participation as the price nears resistance.
If the price successfully breaks and closes above 1.7859, the next target could be around 1.7950 or higher levels. However, failure to break this resistance could lead to a pullback towards immediate support at 1.7724 or even the demand zone near 1.7622. Traders should watch for a volume spike and RSI movement as confirmation of a breakout or rejection at this resistance level.
.png)

.png)


