
Technical Analysis 06.01.2025
EURUSD
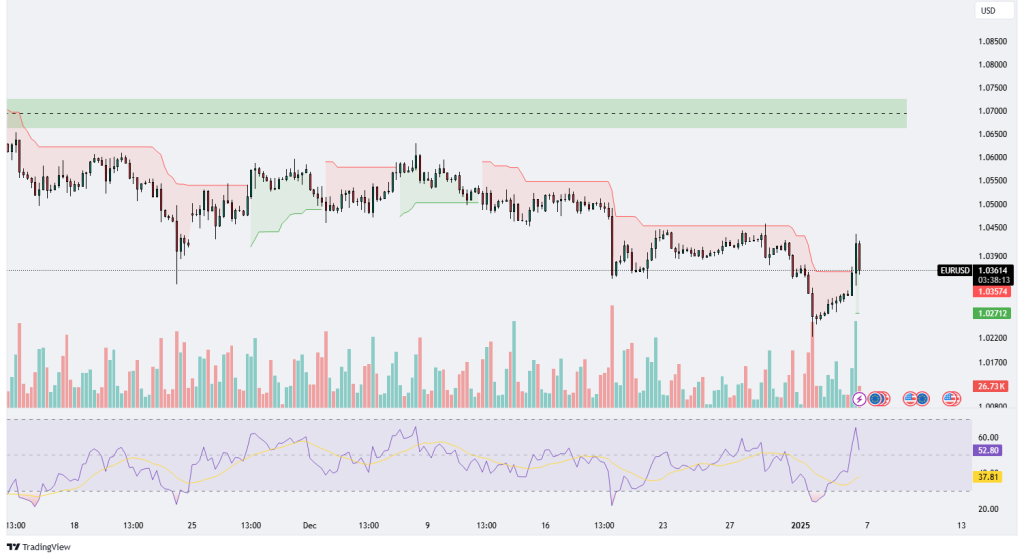
The EUR/USD chart shows a notable spike in buying volume, signaling a strong bullish push after a period of consolidation and downward movement. The price has managed to recover from the recent lows near 1.02712, pushing upward with strong momentum, evidenced by a large bullish candle. The move has also broken above the Ichimoku cloud’s lower boundary, indicating a potential shift in market sentiment from bearish to neutral or bullish. However, the price faced resistance around the 1.03900-1.04000 region, which coincides with a previous consolidation area and is now acting as a key level of interest.
The RSI is at 52.99, reflecting a recovery in bullish momentum but not yet in overbought territory, leaving room for additional upside potential. However, the RSI’s recent spike suggests the price may experience a short-term pullback or consolidation before attempting another move higher. The significant increase in trading volume accompanying the bullish move indicates market participants’ confidence in this upward reversal.
For the bulls, a sustained close above 1.04000 and further upside through 1.04500 would confirm the continuation of the bullish trend, targeting the next resistance level near the 1.05000-1.06000 range. Conversely, if the price fails to maintain above 1.03500, it could retest the support zone around 1.02712. Traders should watch for volume and RSI divergence to assess the strength of the trend and potential reversals, as the current situation suggests a cautious optimism for a continued bullish recovery.

GBPUSD
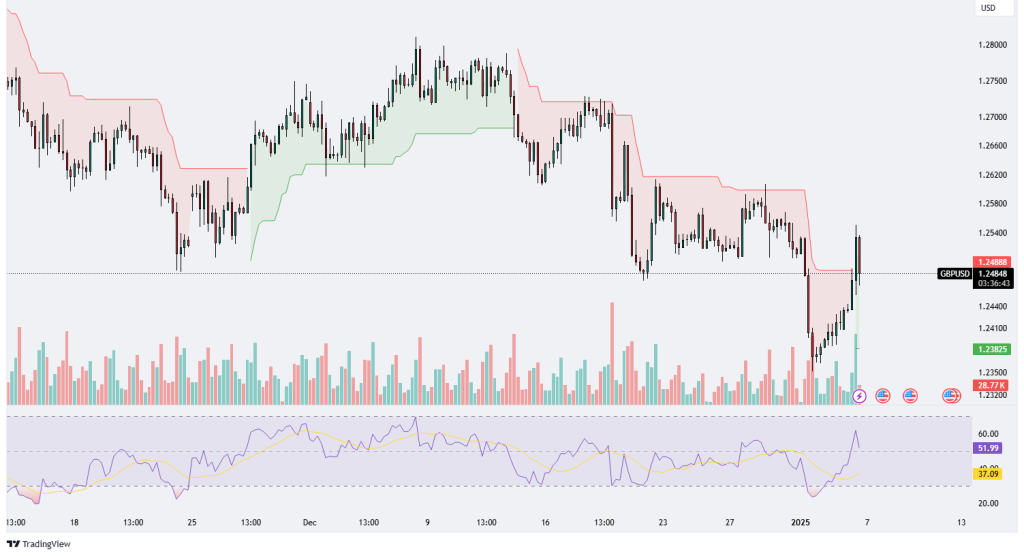
The GBP/USD chart highlights a notable recovery from the recent lows around 1.23825, with a significant bullish breakout above the previous consolidation zone. The price action shows a strong bullish candle, supported by a sharp increase in volume, indicating substantial buying interest. The move has successfully breached the lower boundary of the Ichimoku cloud, signaling a potential shift in momentum towards bullish sentiment in the short term. However, the price is currently facing resistance near 1.24888, which aligns with a prior resistance zone. This level will be a critical area to monitor for potential rejection or a continuation of the upward trend.
The RSI is at 51.91, reflecting a rebound in bullish momentum but still leaving room for further upside before reaching overbought conditions. This suggests that the pair has the potential to extend gains if it can maintain above the key 1.24888 resistance level. On the other hand, failure to sustain above this level may lead to a retracement back towards the 1.24400 support or even a retest of the 1.23825 level.
The volume spike accompanying this move underscores the strength of the recovery, but traders should remain cautious of potential profit-taking at current levels. If the price breaks and sustains above 1.24888, it could target the next resistance levels near 1.25400 and beyond. Conversely, a rejection at this level would signal consolidation or a possible pullback. Overall, the chart reflects a bullish recovery with signs of strengthening momentum, but key resistance levels must be overcome for the trend to solidify.
XAUUSD
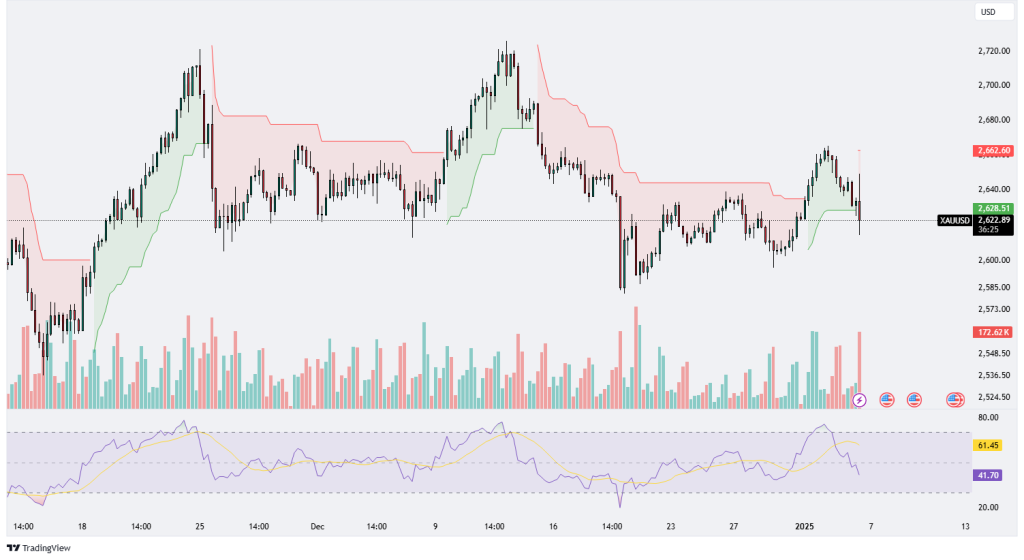
The XAU/USD chart showcases a significant retracement from its recent highs near $2,662.60, following an extended bullish rally. The price has pulled back sharply, breaking below key support levels, and is currently trading around $2,628.51. The Ichimoku cloud indicator reflects mixed signals, with the price oscillating near the lower boundary of the cloud, suggesting a potential transition into bearish momentum if further downside persists. The sharp increase in selling volume, as seen in the accompanying volume indicator, highlights intensified bearish pressure, which adds weight to the corrective move.
From a momentum perspective, the RSI has dropped to 41.58, indicating weakened bullish momentum and approaching oversold conditions. This downturn in momentum aligns with the sharp price decline, suggesting that further downside pressure is possible in the short term unless a strong support level holds. The RSI’s trajectory and current position near neutral-to-oversold levels leave room for further selling or consolidation before a potential reversal can occur.
Overall, the XAU/USD pair appears to be undergoing a healthy correction following its strong bullish trend. The $2,600-$2,620 zone could act as a crucial support region, and a breakdown below this level may expose the pair to deeper corrections toward $2,580 and beyond. Conversely, a recovery back above the Ichimoku cloud and the $2,640 level could renew bullish momentum, paving the way for another attempt at the recent highs. Traders should closely monitor volume dynamics and momentum indicators for clues on the next directional move.
XAGUSD
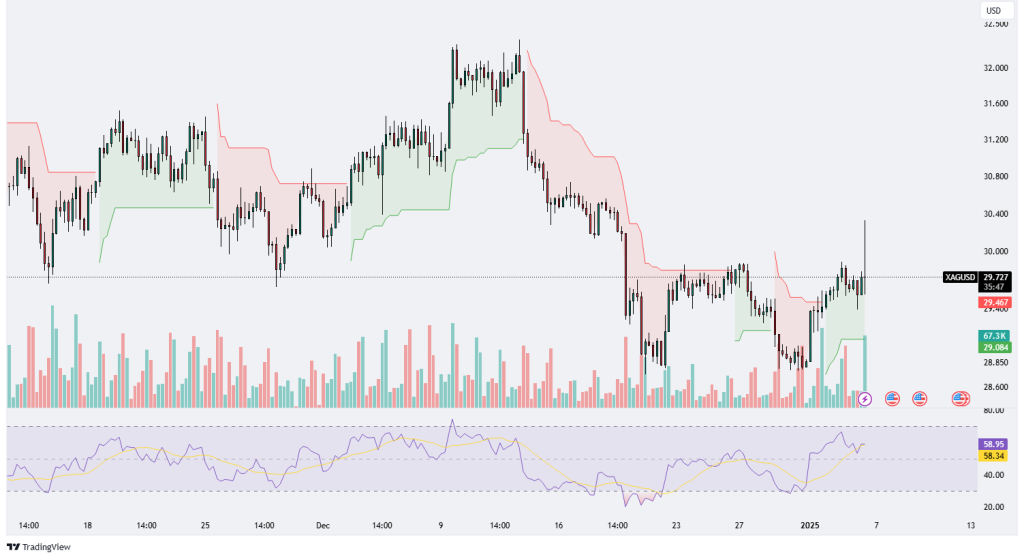
The XAG/USD chart indicates a strong bullish breakout from its recent consolidation range, as the price surges toward $29.73 after spending an extended period oscillating around the $29.00 level. The Ichimoku cloud indicator shows the price breaking above the cloud, confirming a bullish shift in momentum. This breakout is accompanied by a noticeable spike in trading volume, as highlighted in the volume histogram, suggesting increased participation and conviction in the upward movement. The sharp upward move signals a potential trend reversal or a continuation of the broader bullish trend for silver prices.
The RSI is currently hovering around 58.56, moving into bullish territory but not yet overbought, which leaves room for further upside momentum. The RSI’s recent upturn aligns with the price breakout, reinforcing the bullish sentiment. This movement suggests that the market is gaining strength, potentially targeting the next resistance level near $30.00 or higher.
Overall, the technical setup for XAG/USD is leaning bullish, with the breakout above the cloud and the strong volume surge acting as key confirming signals. However, traders should monitor potential retracements or profit-taking around psychological levels like $30.00. The $29.00 level now acts as a critical support, and any sustained move below this level could invalidate the bullish outlook and push the price back into consolidation.
.png)

.png)


