

Technical Analysis 07.01.2025
AUDUSD
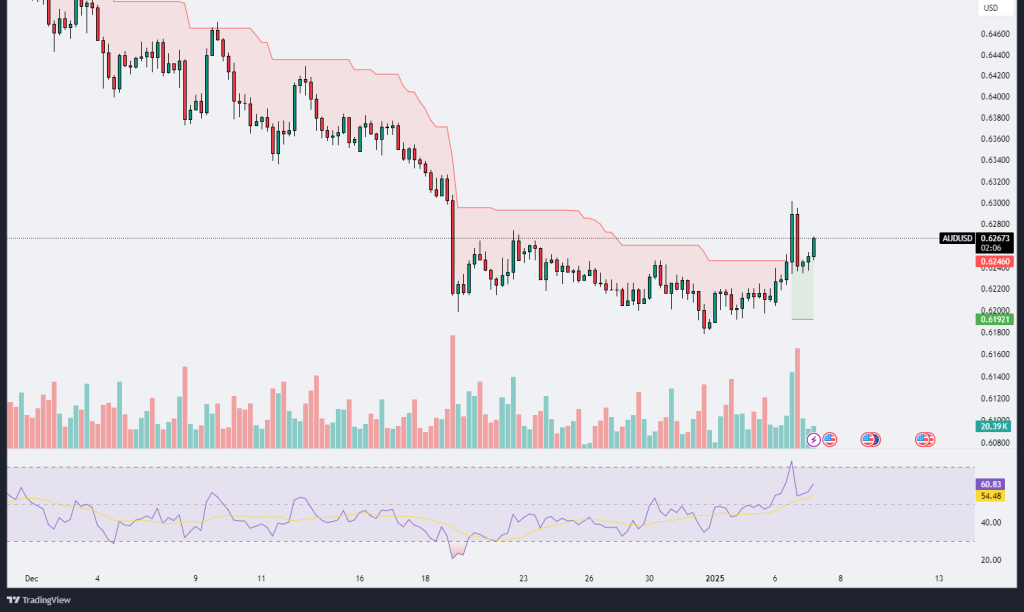
The AUD/USD chart displays a significant bullish breakout following a prolonged consolidation phase, with the price moving above the Ichimoku cloud resistance. Currently trading around the 0.62673 level, this breakout is supported by a noticeable increase in trading volume, as evident in the volume histogram, indicating strong market participation and confidence in the upward movement. The bullish momentum is confirmed by the Relative Strength Index (RSI), which is hovering at 60.83, reflecting increased buying interest without reaching overbought territory. This suggests room for further price appreciation in the short term.
The Ichimoku cloud, which has acted as resistance in the past, now appears to provide a potential support zone, indicating a shift in market sentiment. The move above the cloud signals a possible trend reversal from bearish to bullish. Additionally, the upward spike in the recent candles indicates strong buying pressure, likely triggered by a fundamental catalyst or technical breakout of a key level.
Looking forward, immediate resistance is expected at the 0.6300 psychological level, which could act as a hurdle for further upward movement. On the downside, the 0.6200 level, marked by the lower boundary of the Ichimoku cloud and the breakout zone, now serves as critical support. A sustained move above the current price levels could open the door for higher targets, while any failure to hold above the 0.6200 level might invalidate the bullish bias and lead to a retest of lower support levels. Overall, the technical outlook for AUD/USD suggests bullish momentum with cautious monitoring of key support and resistance zones.
EURJPY
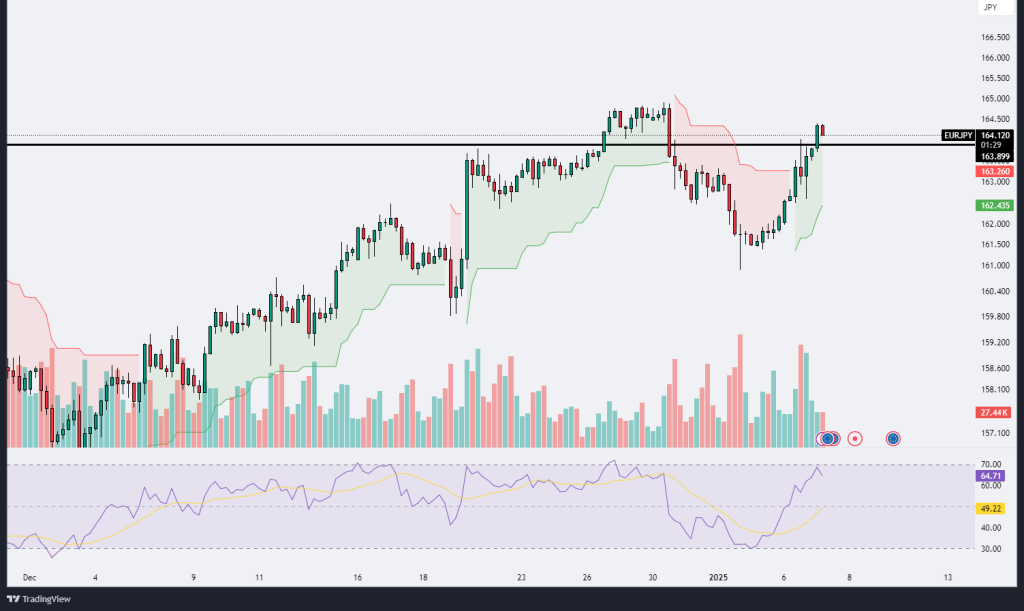
The EUR/JPY chart illustrates a strong bullish momentum as the price breaks above the critical resistance level of 163.899, signaling a potential continuation of the upward trend. The price action is well-supported by the Ichimoku cloud, which has shifted from resistance to support, indicating a positive market sentiment. The volume histogram reflects increased trading activity, particularly on the breakout candles, suggesting strong buying interest and conviction behind the move. The RSI, currently at 64.92, reinforces the bullish narrative as it approaches the overbought territory, though it still allows some room for additional gains.
The price action reveals a robust recovery from recent lows around 161.500, where the price found strong support and initiated a reversal. The breakout above the 163.899 resistance is significant as it marks the clearing of a key supply zone and paves the way for a potential rally toward the next psychological level of 165.000 or higher. The bullish trend is further confirmed by the upward-sloping moving averages and the Ichimoku cloud’s alignment.
On the downside, any pullback is likely to find support near the 163.000 level, which aligns with the Ichimoku cloud and the previous resistance-turned-support zone. Traders should watch for sustained momentum above the breakout level, as a failure to hold above 163.899 could lead to a retracement. Overall, the technical outlook for EUR/JPY remains bullish, with potential upside targets as long as the price sustains above the key support levels.
NZDCAD
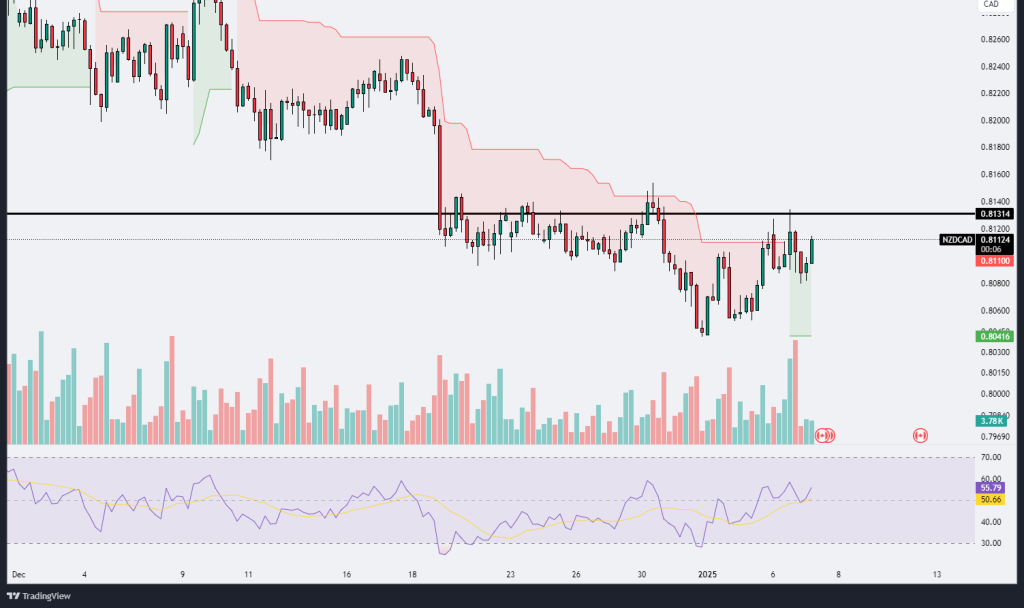
The NZD/CAD chart displays a recent bounce off the 0.80416 support level, followed by a sharp recovery marked by a bullish candlestick pattern. The price is currently testing the significant resistance level at 0.81314, which aligns with the upper boundary of the Ichimoku cloud, acting as a dynamic resistance. The upward momentum is supported by a notable increase in volume, reflecting strong buying interest as the price advanced from the support zone. The RSI indicator has risen above the 55 level and continues to trend upward, indicating a shift in bullish momentum, though it is not yet overbought, leaving room for further gains.
This chart suggests a potential bullish breakout if the price can decisively close above 0.81314, which would invalidate the prior resistance and open the door for further upside toward the next resistance level, likely around 0.82000. However, rejection from this level could lead to a retest of the 0.80416 support, or even deeper levels if bearish pressure intensifies. Traders should monitor the interaction at 0.81314 closely, as this level has proven significant in the past.
The price action reflects a recovery from a prior downtrend, with buyers stepping in at key support levels. A breakout above 0.81314, coupled with sustained volume, would confirm a bullish continuation, whereas failure to breach this level may indicate consolidation or a potential resumption of bearish activity. Overall, the technical indicators favor a cautiously optimistic outlook as long as the price holds above 0.80416 and sustains the bullish momentum.
USDJPY
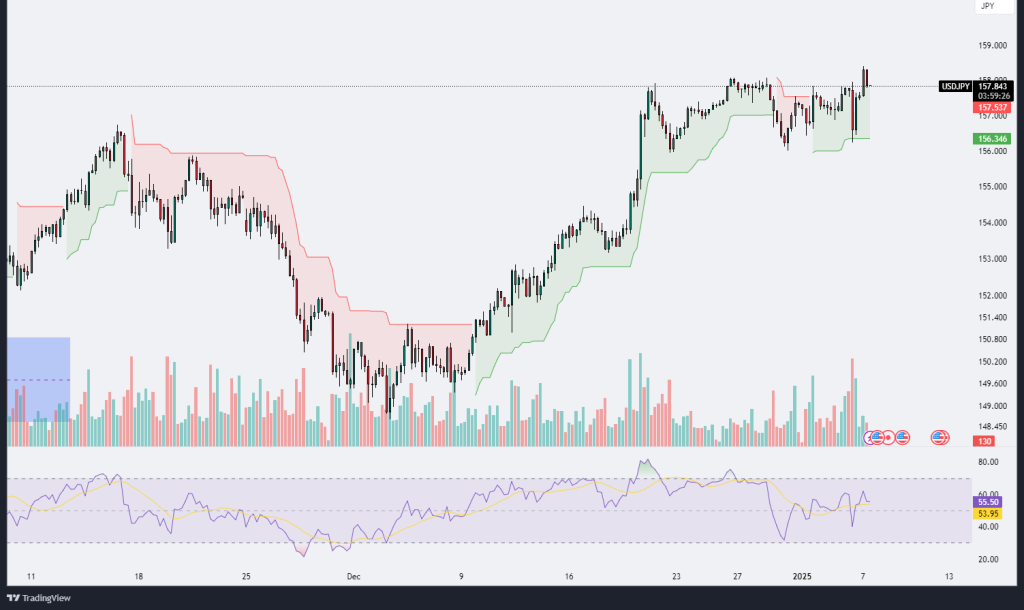
The USD/JPY chart showcases a strong bullish trend, with the price breaking above the Ichimoku cloud and maintaining its position in a clear uptrend. The recent price action has tested the resistance zone around 157.800, which has acted as a psychological barrier. A minor pullback is observed, indicating potential profit-taking or consolidation before another possible upward move. The volume spikes accompanying the upward movements signify robust buying pressure, further strengthening the bullish case.
The RSI indicator hovers near the overbought region, suggesting caution as the price could face resistance and experience a correction or consolidation phase. However, the RSI remains above the 50 level, indicating that the bullish momentum is still intact. The price is trading above the short-term support at 156.346, which aligns with the Ichimoku cloud’s upper boundary, providing a safety net for further bullish moves.
If the price manages to sustain above 157.800, it could trigger further buying interest, pushing the pair toward higher resistance levels. Conversely, failure to break above this level might result in a retracement toward the 156.346 support zone, where buyers may reenter to maintain the uptrend. Overall, the technical indicators suggest that the bullish bias remains dominant, but traders should watch for potential reversals or consolidation in the near term, especially given the proximity to overbought levels.
.png)

.png)


