
Technical Analysis 07.11.2024
XAUUSD
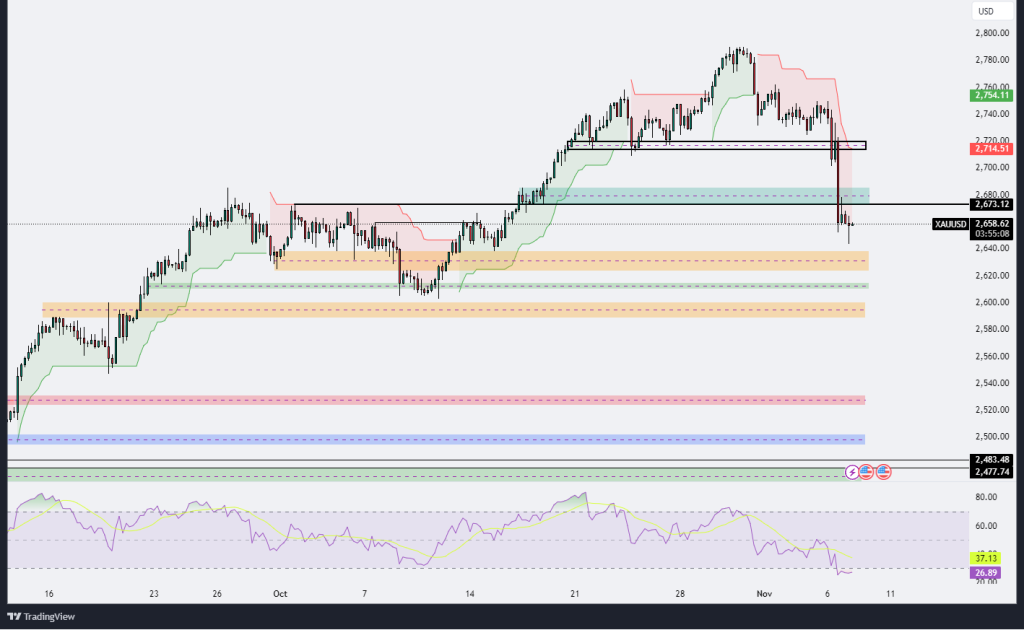
The XAU/USD chart shows a strong bearish movement, with the price breaking down through several key support levels. Currently, XAU/USD is trading around 2,659.01, after a significant drop from the resistance area near 2,760.00, marked by the red Ichimoku cloud, which has acted as a barrier for bullish attempts. This recent decline pushed the price below the critical support at 2,714.13, turning it into a resistance level. Additionally, the breach of the 2,673.12 support level, which is now a potential resistance, indicates that sellers are firmly in control of the market. The Ichimoku cloud above the current price reinforces the bearish outlook, suggesting that any attempted recovery will face challenges within the overhead resistance zone.
The Relative Strength Index (RSI) is at 27.11, signaling that XAU/USD is in oversold territory, which may attract buyers looking for a potential rebound. However, the continued selling pressure, as indicated by the steep drop in the RSI, suggests that the bearish trend could persist despite the oversold conditions. If the downtrend continues, the price may test further support levels around the orange-shaded area near 2,640.00 or lower, where the next consolidation zone lies. Volume remains elevated, indicating strong participation in the recent bearish move, which suggests that the market sentiment is firmly negative at this point.
In summary, the XAU/USD pair is in a pronounced downtrend, with a series of support levels now acting as resistance, and the price trading well below the Ichimoku cloud. Although the RSI indicates oversold conditions, which could trigger a short-term corrective bounce, the overall technical structure remains weak. Any attempted recovery will likely be met with resistance around 2,714.13 and 2,673.12, with a bearish outlook prevailing unless the price can stage a strong recovery above these levels. If sellers maintain control, further declines toward lower support levels around 2,640.00 could be anticipated in the coming sessions.

XAGUSD
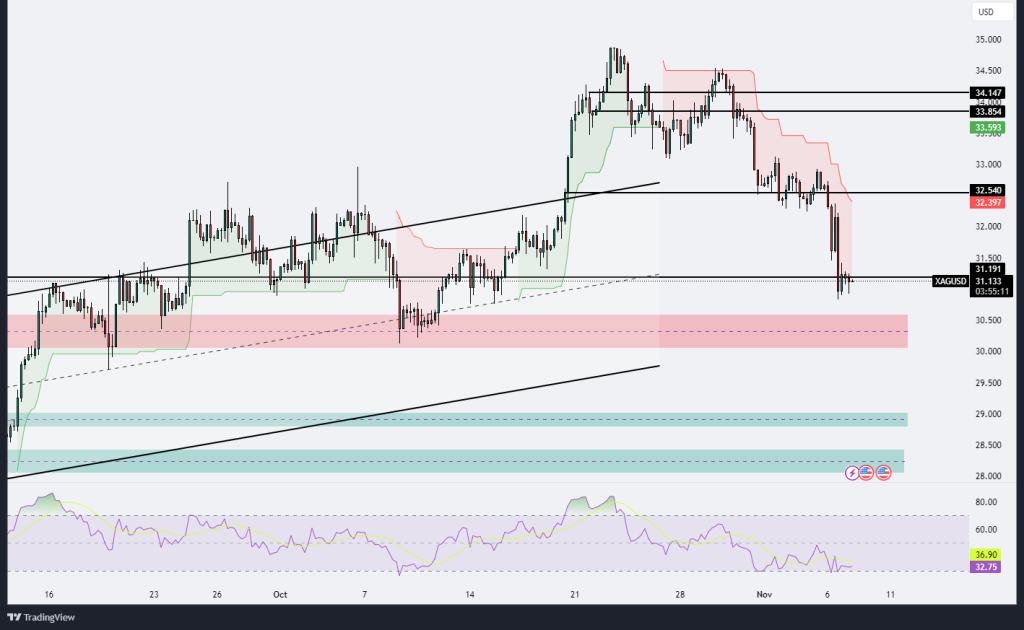
The XAG/USD (Silver vs. USD) chart indicates a strong bearish trend, with a recent sharp decline bringing the price down to around 31.132, after failing to hold above the key resistance levels near 33.854 and 34.147. This substantial drop has taken the price below the Ichimoku cloud, reinforcing the bearish outlook and reflecting the prevailing selling pressure in the market. Currently, the price is testing a critical support area at 31.191, a level that has historically acted as a psychological support, with a potential for further downside if this support fails to hold. The RSI is presently at 32.75, which signals that XAG/USD is approaching oversold territory, indicating that selling momentum might be exhausting, although there is still room for the price to decline further before reaching an extreme oversold condition.
The breakdown of the support levels and the move below the Ichimoku cloud suggest that any short-term rebounds may face significant resistance, particularly around 32.540, which has recently shifted from support to resistance following the breakdown. If the price fails to recover and remains below this resistance, it may continue its descent toward the lower support zone in the red shaded area around 30.500. Further down, additional support exists at the lower green shaded area near 29.000, which would be a critical level to watch if the bearish trend persists.
In terms of volume, recent trading activity has increased during the sell-off, indicating strong participation from sellers and a lack of buying interest to counteract the downward movement. This volume spike during the decline confirms the bearish sentiment and suggests that the market may need to see a consolidation or a significant shift in sentiment before any sustainable recovery. In summary, XAG/USD is in a pronounced downtrend, with strong bearish indicators and limited support until the price approaches the red and green support zones. The current oversold RSI may invite some short-term buying, but the overall outlook remains bearish unless there is a decisive move back above 32.540 and the Ichimoku cloud.
USDJPY
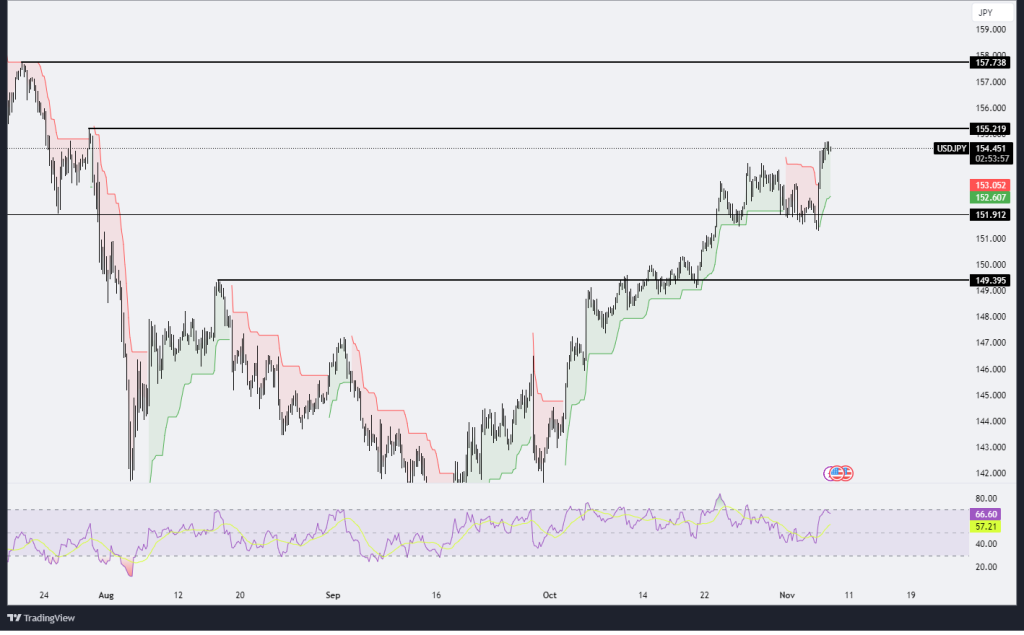
The USD/JPY chart reflects a strong bullish trend, with the price currently testing a critical resistance level at 155.219, following an impressive upward move that began in mid-September. This recent bullish momentum has pushed the pair above the Ichimoku cloud, indicating a robust upward trend with strong support from both technical indicators and market sentiment. The chart shows key levels at 151.912 and 149.395, which previously acted as resistance but now provide strong support levels for the pair. The price is positioned above these support zones, indicating that the buyers are firmly in control, with little indication of selling pressure strong enough to reverse the trend at this point.
The Relative Strength Index (RSI) sits at 66.59, nearing overbought territory but still indicating room for further upward movement. This RSI level suggests that while buying momentum is strong, the price may be due for a consolidation or minor pullback if it reaches extreme overbought conditions. A successful breakout above the 155.219 resistance would open the path for further gains, with the next significant resistance around 157.738. This level could be the next target for buyers if the bullish trend sustains, providing an opportunity for continuation of the uptrend.
In summary, USD/JPY is in a strong bullish trend, supported by the Ichimoku cloud, which serves as dynamic support, and the RSI, which remains near overbought levels but suggests that buying interest is strong. Key support at 151.912 and 149.395 provides a cushion for any potential pullbacks, while resistance at 155.219 is critical for determining the pair’s next direction. A break above this level would signal continued bullish dominance, while failure to break may lead to a brief consolidation phase before another attempt to resume the uptrend.
AUDUSD
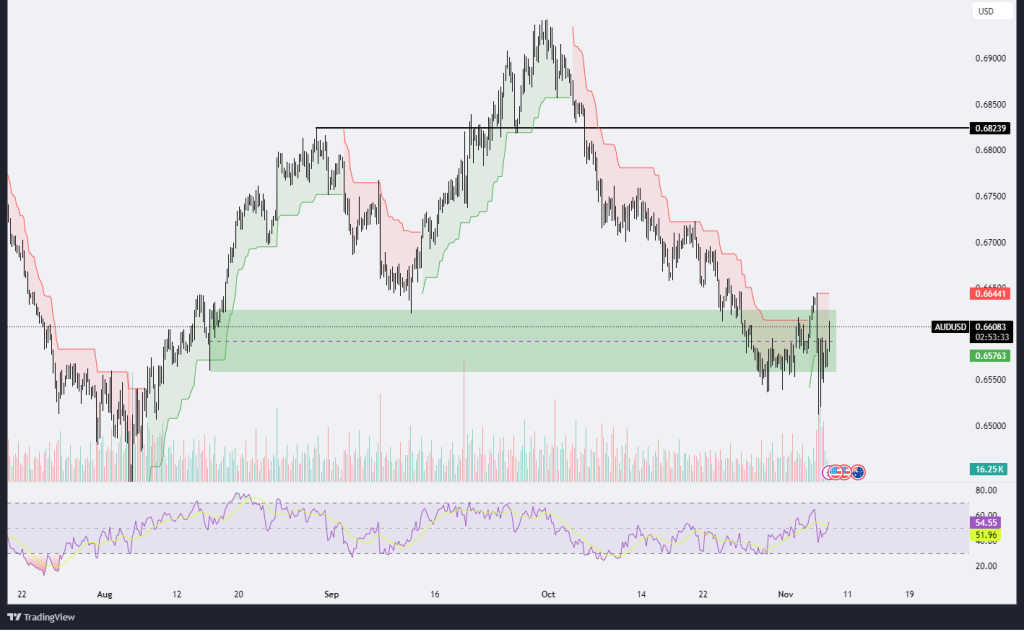
The AUD/USD chart shows a recent attempt to recover from a pronounced downtrend that brought the price into a critical support zone, marked by the green shaded area around the 0.65763 level. This area has acted as a strong support base, allowing for some buying momentum to emerge, pushing the price back up to the current level of 0.66083. The Ichimoku cloud above the price remains red, reflecting the ongoing bearish bias, but the recent bullish momentum has challenged this trend, with buyers attempting to break through the resistance around the 0.66441 level. However, this level continues to act as a formidable resistance, preventing further upward movement for now.
The Relative Strength Index (RSI) is at 51.96, indicating a relatively neutral stance, though it has recently risen from oversold conditions. This suggests that there is potential for a further recovery if buying momentum persists. The RSI’s rise above 50 hints at strengthening bullish sentiment, though it remains to be seen if this is sustainable. Volume has seen a notable increase during the recent bounce, indicating active participation from buyers, which could support a potential reversal if the momentum is maintained.
In summary, AUD/USD is at a pivotal point, attempting to establish a reversal within a strong support zone. The resistance at 0.66441 remains a key barrier that needs to be overcome to confirm a more sustained bullish move. The Ichimoku cloud above signals continued caution, suggesting that while there is potential for a rebound, significant resistance remains in place. A successful breakout above 0.66441 would open up the possibility of a move toward higher resistance levels, while failure to break this level may lead to further consolidation or a retest of the support zone near 0.65763. The neutral RSI and increased volume indicate a balanced outlook with cautious optimism for buyers.
.png)

.png)


