

Technical Analysis 08.11.2024
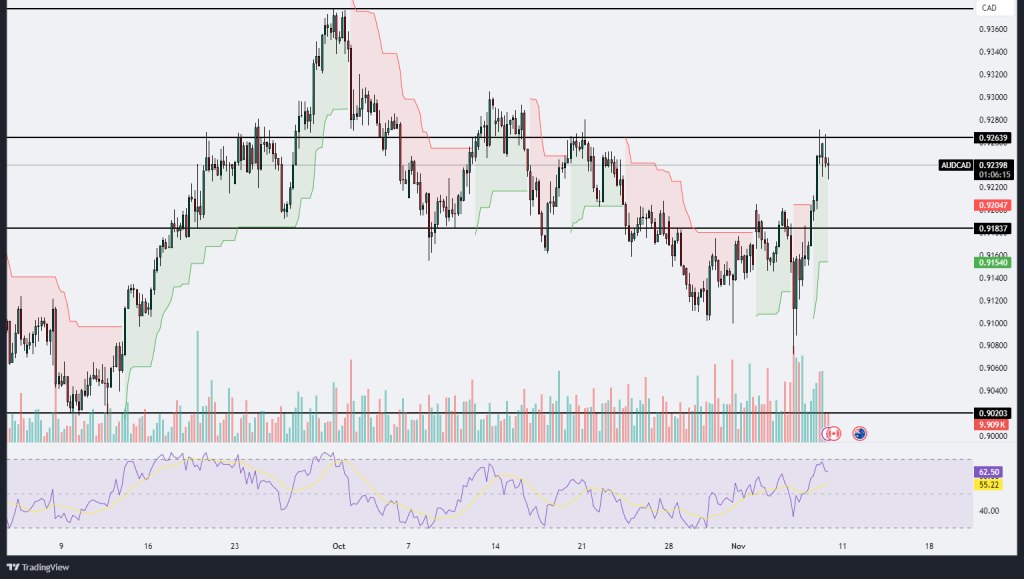
AUDCAD
The AUD/CAD chart illustrates recent price action where the pair has reached a significant resistance zone around the 0.92639 level after a sharp rally. This area has previously acted as a ceiling, limiting upward momentum, and the current price behavior shows hesitation at this level, with a slight pullback to 0.92380. The Ichimoku cloud in this area has turned red, reflecting a cautious sentiment as the price approaches this resistance. Below the current level, there is another key level of interest around 0.92047, which previously acted as resistance and may now function as support if the price pulls back further. The 0.91837 mark provides additional support, aligning with previous accumulation zones that saw significant buying interest.
Volume during the recent upswing has notably increased, suggesting strong buyer interest, although the volume has started to taper off slightly as the price nears resistance, indicating potential profit-taking or a lack of buying conviction at higher levels. The RSI, currently around 61.93, has entered into slightly overbought territory but remains below the extreme threshold, indicating that there is still room for upward movement if buying interest returns. However, the RSI’s recent downward bend could suggest the start of a consolidation phase if buyers do not step in to break the 0.92639 resistance decisively.
In summary, AUD/CAD is at a critical juncture as it tests the upper boundary of its current range. A successful breakout above 0.92639 with strong volume could signal further bullish momentum, targeting the next resistance level around 0.93783. However, failure to maintain gains above this level could lead to a retracement toward support at 0.92047 or even lower, around 0.91540, where buyers may potentially regroup. The RSI and volume metrics suggest a balanced outlook, with a slight bullish bias, but further confirmation is needed for a sustained rally.
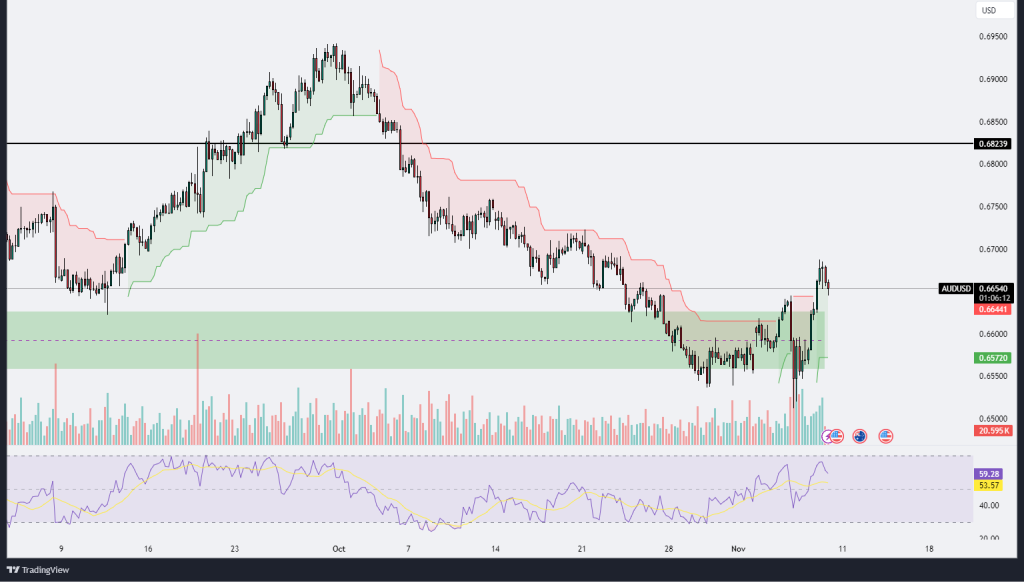
AUDUSD
The AUD/USD chart shows a recent price rebound from the support zone around 0.65720, where strong buying interest previously held the price above this level. Following a prolonged downtrend marked by the red Ichimoku cloud, the recent upward move has brought the price back above 0.66330, signaling a potential shift in sentiment or at least a temporary relief from the bearish pressure. However, the price is now facing resistance around 0.66441, which could determine whether this upward momentum is sustained or if it will reverse back towards support. The Ichimoku cloud, which turned green during the upward move, indicates a possible bullish transition, but the presence of red clouds in the recent past suggests caution.
Volume during the latest upward move has been significant, indicating strong interest in pushing the price higher; however, the recent candle shows some resistance, with a slight pullback and reduced volume, which might indicate waning bullish momentum or the presence of profit-taking at higher levels. The RSI, currently at 59.02, is approaching the overbought territory but has not yet reached extreme levels, suggesting there could still be some room for the price to advance. However, if the RSI turns downward, it may signal a potential retracement or consolidation phase as the market digests the recent gains.
Overall, AUD/USD is in a critical testing phase as it approaches the resistance at 0.66441. A successful breakout above this level with continued volume support could indicate further bullish potential, possibly targeting the next resistance area around 0.68239. However, failure to break above this level may lead to a pullback, with 0.65720 as the key support where buyers may look to defend the recent gains. The market currently leans bullish, but caution is warranted as resistance levels come into play.
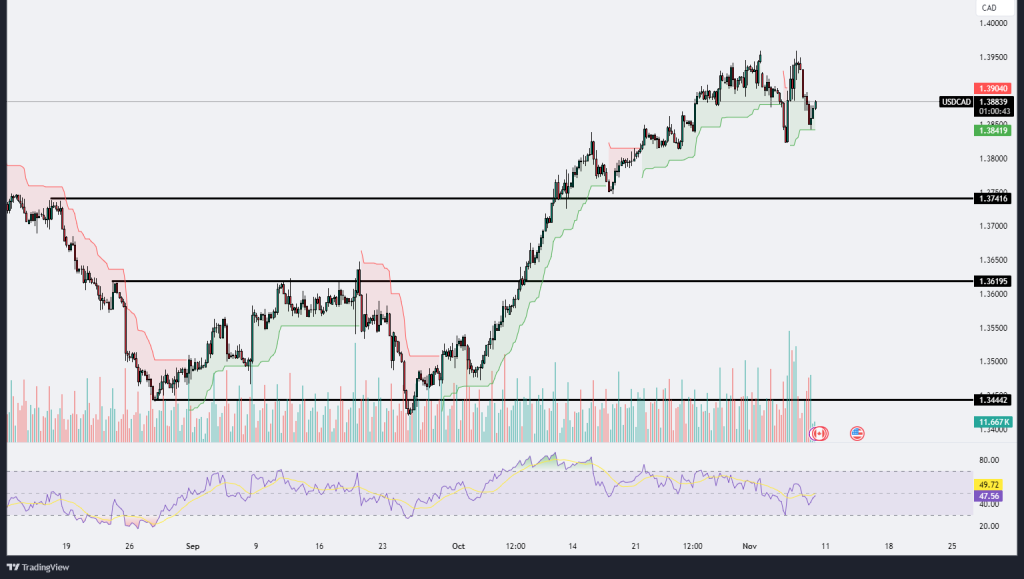
USDCAD
The USD/CAD chart indicates a recent retracement after a strong upward trend that began around mid-September, where price action broke through multiple resistance levels, moving from around 1.34442 to near the 1.39040 area. This upward momentum was supported by a shift in the Ichimoku cloud color from red to green, reflecting a bullish trend continuation. The initial breakout from the 1.36195 level seemed to accelerate buying interest, pushing the price past 1.37416, which now acts as a significant support level. Currently, the price is experiencing a slight pullback from recent highs, testing the 1.38419 support level. The Ichimoku cloud has narrowed at the current price, suggesting possible consolidation or a reduction in bullish momentum as the market evaluates the recent gains.
Volume levels have fluctuated, with a notable increase during the initial breakout stages, indicating strong market conviction. However, as the price approached the 1.39040 resistance level, volume tapered, which could signal that buyers are either taking profits or that there is uncertainty in pushing beyond this resistance without further catalysts. The RSI is hovering around 49.74, a neutral zone, indicating neither overbought nor oversold conditions but a potential balance between buying and selling pressures. If the RSI begins to move upward, it might indicate renewed buying interest that could lead to a re-test of 1.39040 or higher levels. Conversely, a downward RSI trend may reinforce the pullback, potentially testing lower support levels, such as 1.37416, which could serve as a key area for buyers to defend.
Overall, USD/CAD appears to be in a consolidation phase following a robust bullish rally. The next few trading sessions could determine whether the pair will gather enough momentum to break above 1.39040 and continue its upward trajectory or if a deeper retracement will ensue, challenging support levels at 1.38419 and 1.37416. Traders will likely watch these key areas closely, as well as any shifts in the Ichimoku cloud and volume spikes, to gauge market sentiment and potential price direction in the near term.
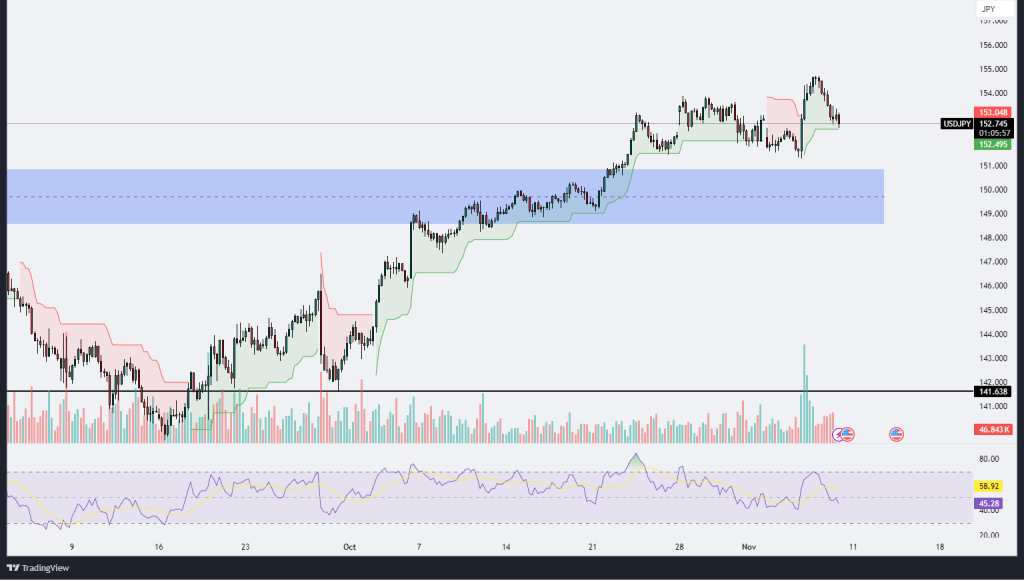
USDJPY
The USD/JPY chart reveals a strong upward trend that began around mid-September, following a consolidation phase in the 141.638 zone, where it had previously established a base. After breaking through this support, the price surged with sustained bullish momentum, piercing through resistance zones and confirming a higher-low structure. The Ichimoku cloud, shifting from red to green, confirmed this bullish trend, reflecting favorable sentiment and an increase in buying pressure. A key support zone, highlighted in blue around the 150 level, served as an area of consolidation before the price continued upward. Currently, the price hovers around the 153 level, where it appears to be facing some resistance, as indicated by a minor pullback from recent highs. The RSI indicator, positioned near 58.91, suggests that buying pressure remains moderately strong, though it has not yet reached overbought levels, implying potential for continued upward movement if buying interest sustains.
Volume analysis indicates significant buying interest during the initial breakout above the 150 level, suggesting that the upward movement was supported by high trading activity and market conviction. However, the volume has tapered off slightly as the price approached the 153 resistance level, indicating that traders may be cautious around this price zone, potentially taking profits or waiting for further confirmations before committing to new positions. If USD/JPY maintains its position above the blue support zone and manages to break past the 153 level, it could attract further buying interest, leading to a retest of the higher resistance near 155. Conversely, if sellers gain control, the price may retrace to retest lower support levels, with the Ichimoku cloud likely serving as a dynamic support indicator. In summary, the USD/JPY pair currently exhibits bullish momentum with some resistance near 153, and future price action will likely hinge on whether it can break past this level or if it will retrace to consolidate within its previous support zones.
.png)

.png)


