

Technical Analysis 09.10.2024
AUDUSD
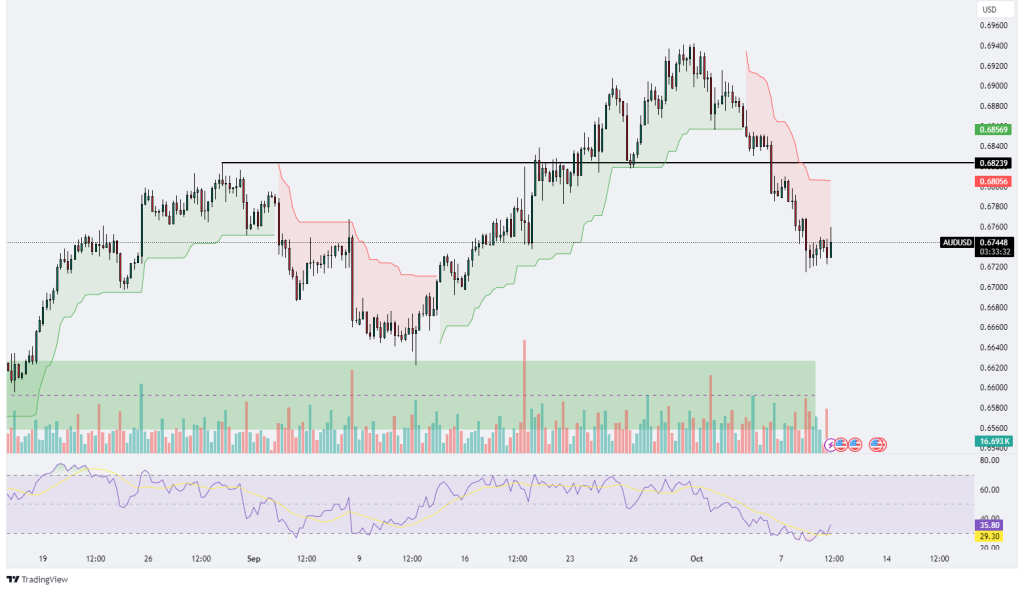
The AUD/USD price chart shows a clear downtrend since the beginning of October, marked by a series of lower highs and lower lows. The price action has broken below a key support level around 0.6823, which now acts as a strong resistance. This level previously served as support in early September, indicating its significance as a potential reversal point. After this breakdown, the pair attempted a recovery but faced rejection around the 0.6805 resistance zone, further solidifying the bearish outlook.
The Ichimoku Cloud indicator on the chart visually highlights the bearish sentiment, with prices trading consistently below the red cloud, signaling sustained selling pressure. The failed retest of the lower boundary of the cloud further confirms that the bearish trend is likely to persist unless a clear breakout above the cloud occurs. Moreover, the Relative Strength Index (RSI) at the bottom of the chart is currently hovering around 37.99, showing signs of being in the oversold territory but still not presenting a strong reversal signal yet. RSI values below 30 typically indicate oversold conditions; however, the slight uptick suggests that sellers might be temporarily exhausted.
Volume analysis shows a spike in selling volume during the recent price decline, reinforcing the bearish momentum. The volume has since tapered off, suggesting that there could be some consolidation or a minor bounce before the next significant move. Key support levels to watch are at 0.6740 and 0.6620, while any upward movement will likely face resistance around 0.6805 and 0.6823. Traders should be cautious of potential false breakouts, as the RSI suggests there could be a temporary pause in the selling pressure before resuming the downward trend.
EURGBP
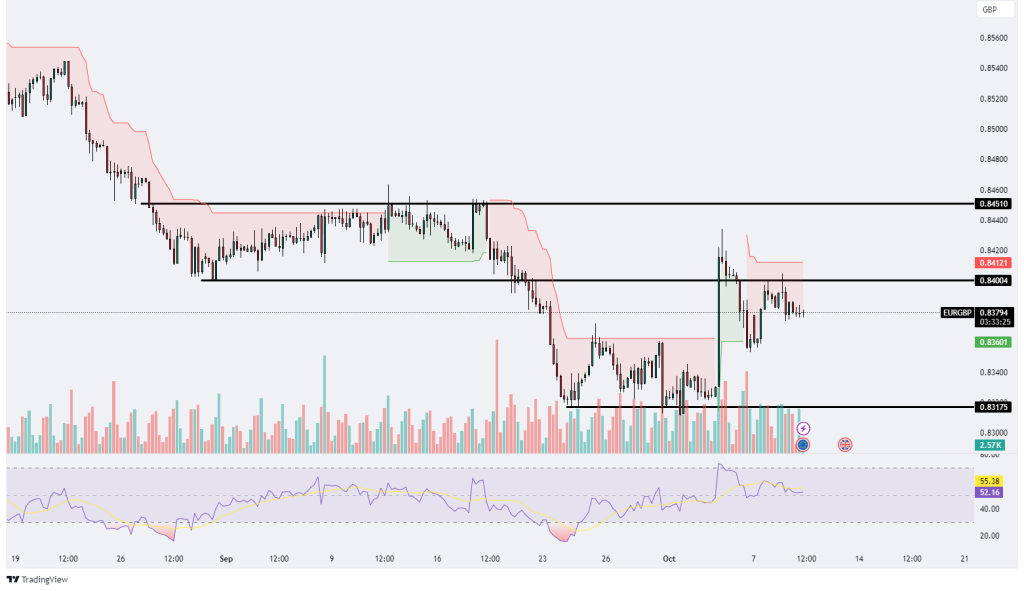
The EUR/GBP price chart indicates a prolonged downtrend, highlighted by a series of lower highs and lower lows that have persisted since mid-August. The pair found strong support around the 0.83175 level, which has been tested multiple times, suggesting that buyers are defending this area robustly. On the upside, the price attempted a recovery towards the 0.8410 resistance zone, which aligns with the Ichimoku Cloud’s lower boundary, acting as a key resistance area. This level has historically served as a turning point, and the price faced heavy selling pressure each time it approached it, indicating the strength of bearish momentum.
The Ichimoku Cloud indicator is predominantly red, showing that the bears are in control. The pair’s failure to close above the cloud suggests that any upward movement may be limited unless a decisive breakout above 0.8410 occurs. Moreover, the horizontal resistance around 0.8451 is a critical level to watch, as it previously acted as a major support before the bearish breakout in September. A reversal above this level would signal a potential trend shift; however, as long as the price remains below 0.8410, the downtrend appears intact.
Volume analysis reveals a consistent decline in trading activity, particularly during the recent consolidation phase between 0.83175 and 0.8400, indicating a lack of conviction from both buyers and sellers. This low volume suggests that the current sideways movement could continue in the short term, with a potential for a breakout if volume picks up. The Relative Strength Index (RSI) below the chart is currently at 55.38, which is in neutral territory but leaning towards overbought. This positioning signals that the recent bounce could be losing steam and that there may be limited upside potential unless the price breaks above 0.8410 convincingly.
Overall, EUR/GBP remains bearish as long as it trades below the 0.8410 and 0.8451 resistance zones. Key support levels to monitor are at 0.8360 and the major support at 0.83175. A break below 0.83175 would open the door for further downside, potentially targeting lower support zones. Traders should keep an eye on the RSI and volume patterns for early indications of a breakout or a continuation of the existing trend.
USDCAD
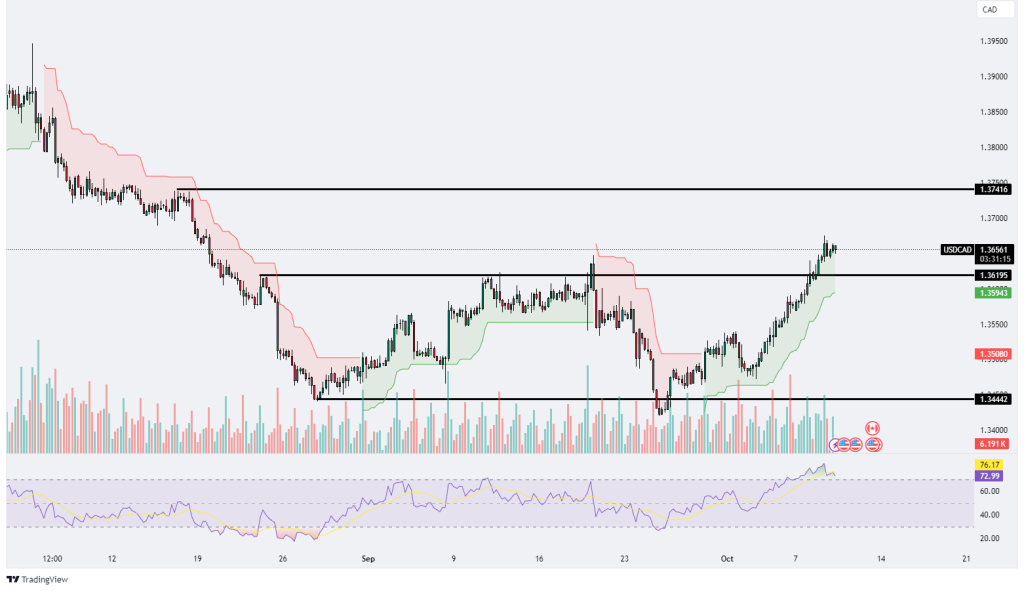
The USD/CAD chart shows a recent strong bullish momentum, with the pair breaking above a key resistance level at 1.3619, which is now acting as a support. The price is currently trading around 1.3566, suggesting that the bullish momentum might be facing temporary resistance. If the pair sustains its position above 1.3619, it could potentially target the next major resistance at 1.3741, which aligns with the previous high established in early September.
The Ichimoku Cloud indicator is green, signaling a strong bullish trend, and the price is well above the cloud, indicating that buyers are in control. The RSI indicator is currently in overbought territory at around 76.18, which suggests that the pair might be due for a short-term correction or consolidation before making its next move higher. If a pullback occurs, the immediate support level to watch is 1.3619. A break below this support could lead to a deeper retracement towards 1.3594 or even lower to 1.3444, which is a significant support area from late September.
Volume analysis shows an increasing trend during the recent bullish push, confirming strong buying interest. However, the latest candles are showing slightly declining volume, which, combined with the overbought RSI, indicates that buyers might be taking a pause. This divergence could signal a potential exhaustion in the uptrend, and traders should be cautious of a potential correction before another leg up.
To summarize, the overall outlook for USD/CAD remains bullish as long as the pair stays above 1.3619. The next key target on the upside is 1.3741, while downside risks include a break below 1.3619, which could lead to a test of the lower supports at 1.3594 and 1.3444. Traders should watch for potential reversal signals such as bearish divergence on the RSI or a spike in selling volume to gauge the strength of the current uptrend.
.png)

.png)


