
Technical Analysis 12.12.2024
EUR/USD
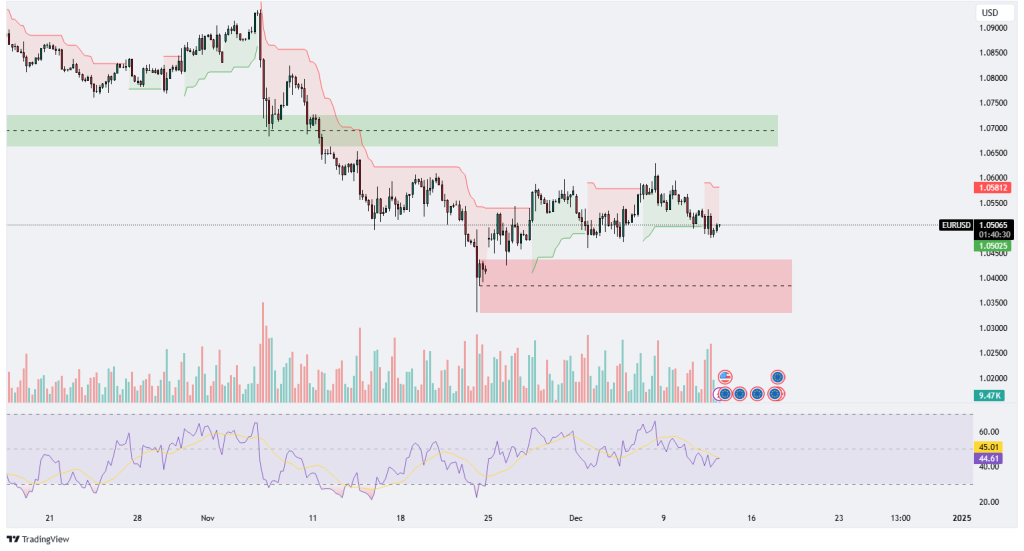
The EUR/USD chart reflects a consolidation phase within a well-defined range. The price is trading above the critical support level near 1.0450, highlighted as a key demand zone due to previous strong buyer activity. Resistance is evident in the 1.0650-1.0700 range, representing a significant barrier for bullish attempts.
The Ichimoku cloud indicates bearish sentiment, with the price remaining below the cloud. Recent candles suggest a pause in bearish momentum, as the price attempts to stabilize. The RSI, at 44-45, reflects limited buying pressure but not oversold conditions, pointing to a neutral stance.
Volume analysis shows declining activity, reflecting indecision. A break below the 1.0450 support could drive the pair toward 1.0350. Conversely, a bounce from support, accompanied by increased volume, might lead to a retest of the 1.0650 resistance. Traders should monitor the RSI for divergence and observe volume spikes for confirmation of a breakout or breakdown.

GBPUSD
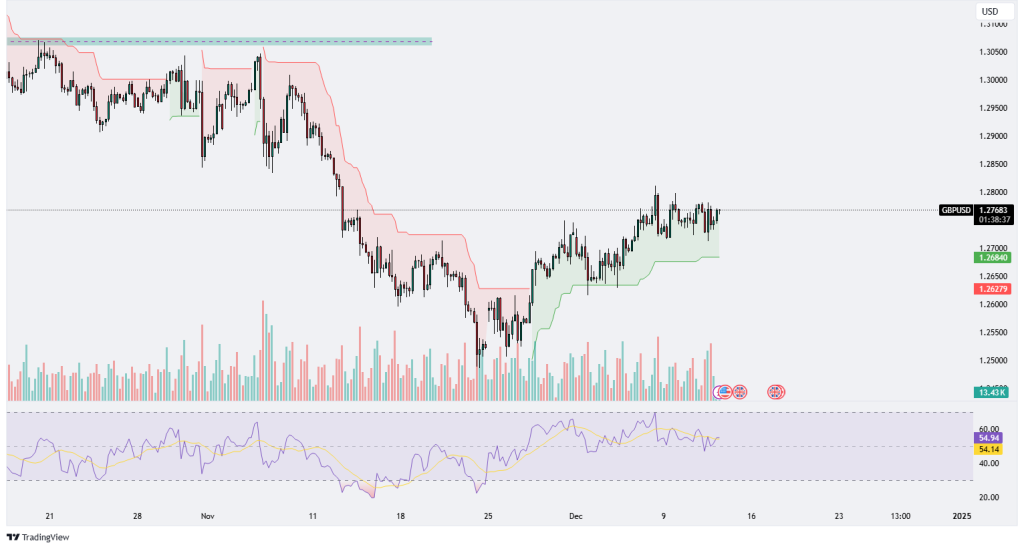
The GBP/USD chart shows consolidation after a sharp decline, with the price trading near 1.2768. The range is bounded by support at 1.2680 and resistance at 1.2800, which aligns with the Ichimoku cloud, suggesting indecision in market sentiment.
The RSI, at 55, indicates a slight bullish bias but lacks the strength for a clear breakout. Volume analysis reveals subdued activity, underlining the market’s hesitance.
A break above 1.2800, supported by rising volume, could confirm bullish momentum, targeting 1.2900. Conversely, a fall below 1.2680 may lead to further bearish movement, with the next support around 1.2600. Traders should focus on momentum indicators and volume for signs of a decisive move.
XAUUSD
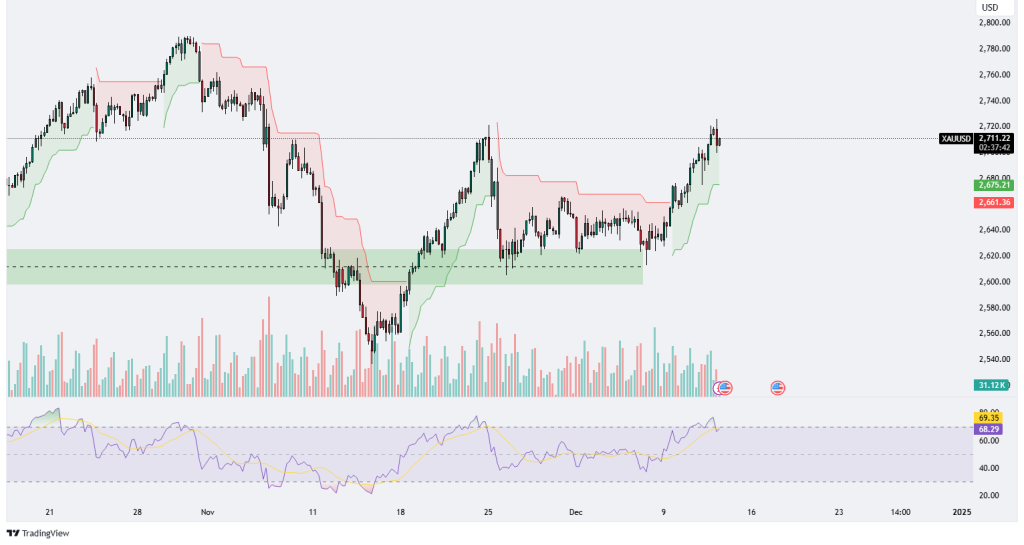
Gold has experienced a robust recovery, trading near $2,711.30 after finding strong support in the $2,650-$2,675 demand zone. The price has broken above the Ichimoku cloud, signaling a shift to bullish sentiment. Resistance is evident at $2,720-$2,740, where profit-taking could occur.
The RSI, at 69, indicates overbought conditions, suggesting a possible pullback or consolidation. Volume analysis reveals moderate growth during the recent rally, affirming buyer interest.
If the momentum persists, Gold may target $2,750 or higher. However, a retracement below $2,675 could signal weakening momentum, with $2,650 acting as the next key support. Traders should monitor RSI and volume for signs of exhaustion or continued bullish activity.
XAGUSD
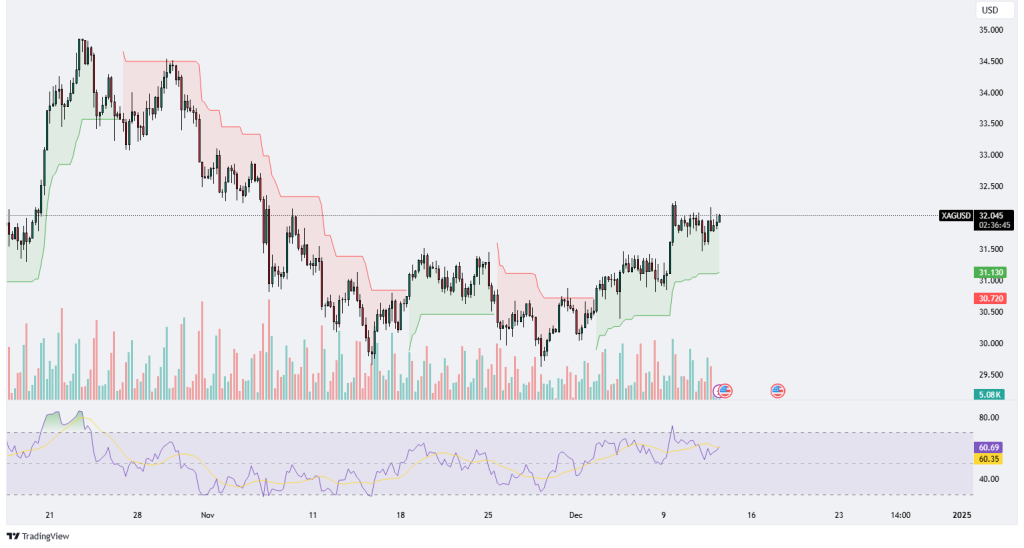
The XAG/USD chart reveals a consolidation phase following a previous upward momentum, with the price currently hovering around 32.045. This level is significant as it lies within a zone of resistance, suggesting that silver is struggling to break higher but maintains bullish undertones. The price remains above the Ichimoku cloud, reinforcing a positive outlook, while the cloud’s thickness indicates stable support levels below, around the 31.00-30.72 range. The bullish structure is further supported by a sequence of higher lows visible since late November, reflecting growing demand.
The RSI is currently near 60.69, signaling a moderately overbought condition but still leaving room for upward movement. This suggests that while the uptrend could extend, caution is warranted as silver approaches key resistance levels. Volume analysis reveals a tapering off compared to earlier spikes, indicating a potential lack of strong momentum from buyers, which might lead to a short-term pullback or continued range-bound movement unless significant market catalysts arise.
A decisive break above 32.50 could open the door for further gains toward the 33.00 level, while failure to sustain momentum might see the price retracing toward the support zone near 31.00. Traders should watch for volume expansion to confirm any breakout, and a dip below 30.72 would invalidate the bullish structure, signaling potential downside risk.
.png)

.png)


