

Technical Analysis 13.11.2024
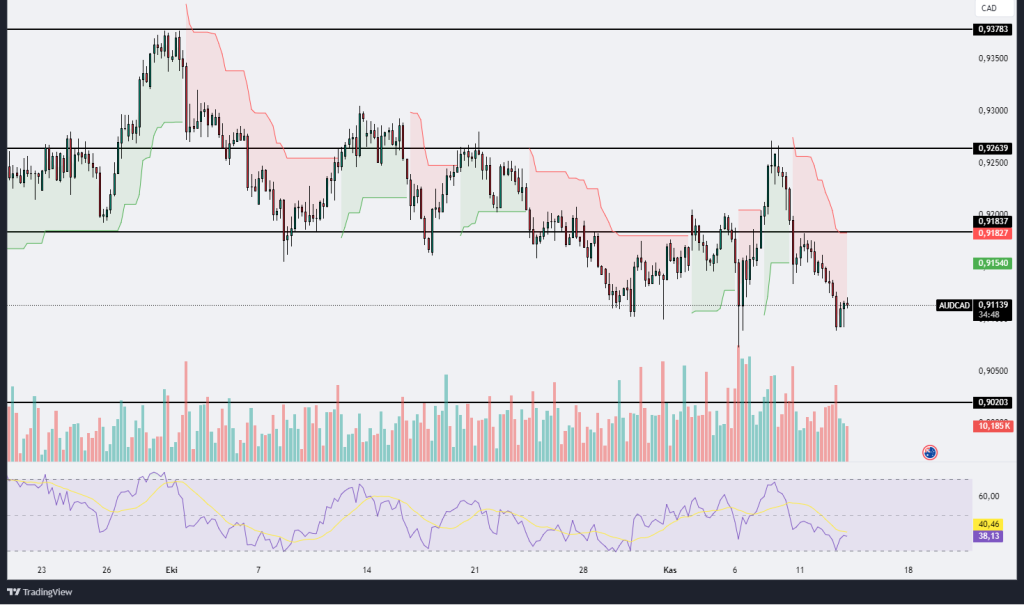
AUDCAD
The AUD/CAD chart is displaying a bearish trend, with the price breaking below key support levels, indicating a sustained downward movement. The pair is currently trading around the 0.91139 mark, following a recent rejection at the 0.91837 resistance level, as highlighted by the Ichimoku cloud, which remains red and hovers above the price, reinforcing the bearish outlook. This downward trend is further supported by the Relative Strength Index (RSI), which is hovering around 40.46, close to the oversold threshold, suggesting the possibility of continued bearish pressure, albeit with a potential for a short-term bounce if oversold conditions are reached. Volume analysis shows a mix of buying and selling, with significant spikes during recent downward movements, indicating heightened market activity as sellers dominate. If the price continues to decline, the next significant support lies around 0.90203, where buyers might attempt to step in. However, if the price manages to close above the 0.91837 resistance, it could signal a reversal or consolidation phase. Traders should watch for any signs of a break below the immediate support or a close above resistance, as either scenario would provide insights into the AUD/CAD pair’s future direction.
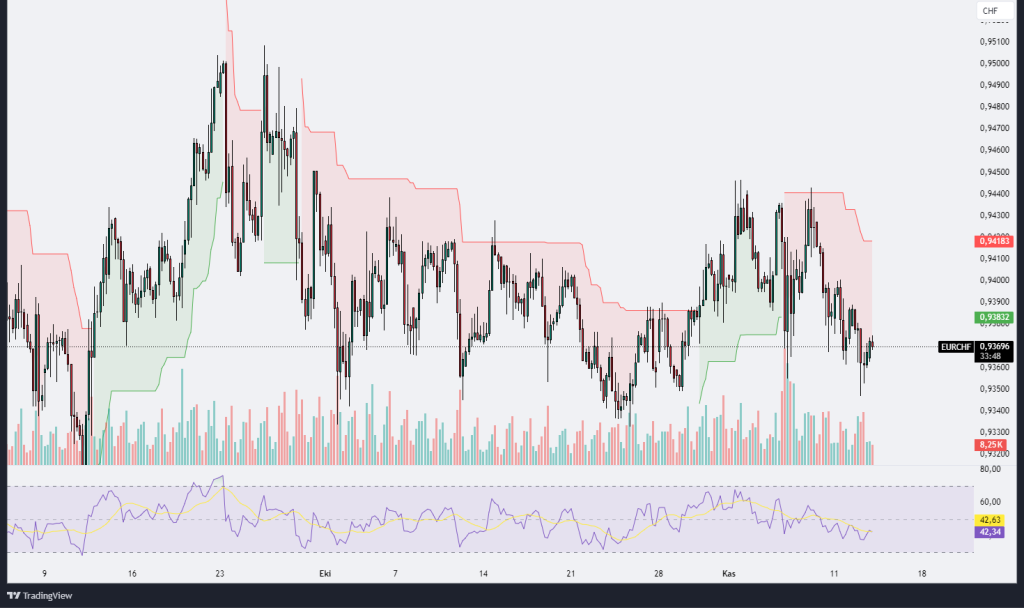
EURCHF
The EUR/CHF chart shows a consolidative phase with the price oscillating between key support and resistance levels, reflecting indecision in the market. Currently, the pair is trading around the 0.93696 level, attempting to rebound after a recent dip below the Ichimoku cloud, which remains red, signaling a bearish bias. However, this bearish sentiment has not been overwhelmingly strong, as the price has oscillated back and forth without a clear breakout or breakdown. The Ichimoku cloud, with red dominance, indicates overhead resistance, which could keep the price pressured below key levels such as 0.93882 and 0.94183, where sellers may assert control. The Relative Strength Index (RSI) is slightly above 42, leaning towards oversold territory but not signaling strong buying pressure yet, which aligns with the muted buying volume seen in the recent bars. Volume analysis shows intermittent spikes during recent declines, suggesting that sellers have been more active, though without a pronounced follow-through. If the price manages to break above the immediate resistance, it could challenge the 0.94183 level, potentially reversing the bearish outlook. On the downside, a failure to sustain above 0.93600 could bring further declines towards support levels around 0.93300. Overall, the EUR/CHF pair appears to be in a range-bound environment, with traders watching for a decisive move either above resistance or below support to gauge the next directional trend.
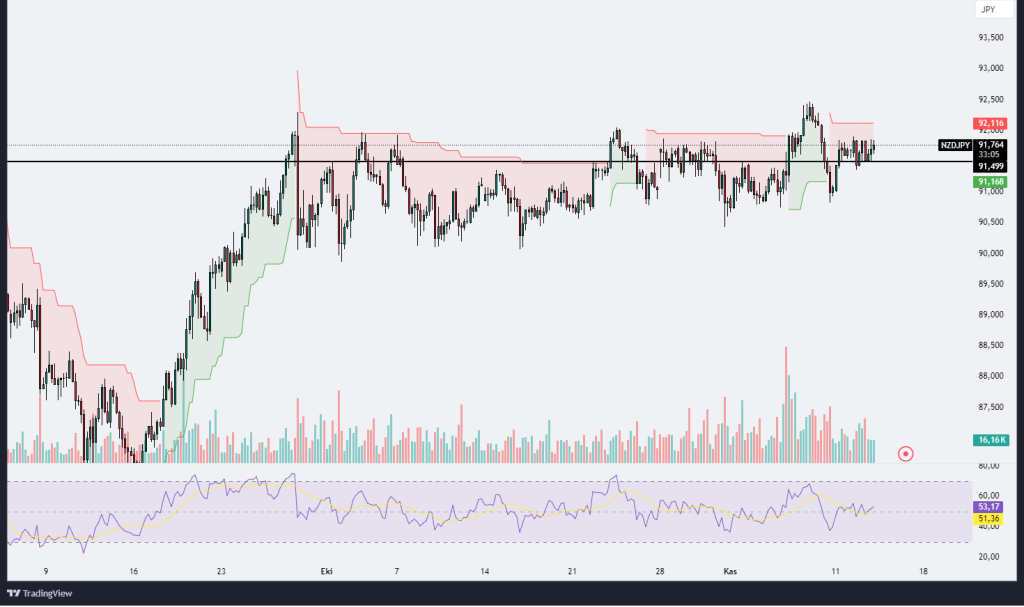
NZDJPY
The NZD/JPY chart displays a consolidative pattern near the resistance level of 92.116, with the price consistently oscillating within a narrow range. The Ichimoku cloud above the price shows a red zone, indicating persistent resistance and a potential challenge for bullish momentum. Despite occasional upward movements, the pair has struggled to break decisively above this resistance, suggesting that sellers are actively defending this level. The price is hovering around 91.764, close to the 91.168 support line, which has held firm through recent dips, highlighting it as a critical level for bulls to maintain. Volume appears relatively stable, with no substantial surges, indicating a lack of strong conviction in either direction at this stage. The RSI is mildly above 50, around 53.17, showing a balanced momentum with neither bullish nor bearish dominance, though it leans slightly towards neutrality. This RSI level, combined with the price’s consolidation near resistance, suggests that traders are waiting for a catalyst to confirm the next trend direction. A breakout above 92.116 could indicate a renewed bullish trend, potentially targeting higher resistance zones, while a drop below 91.168 might lead to further declines, testing deeper support areas around 90.00. In summary, the NZD/JPY pair is in a critical holding pattern, with a breakout in either direction likely setting the tone for upcoming trading sessions.
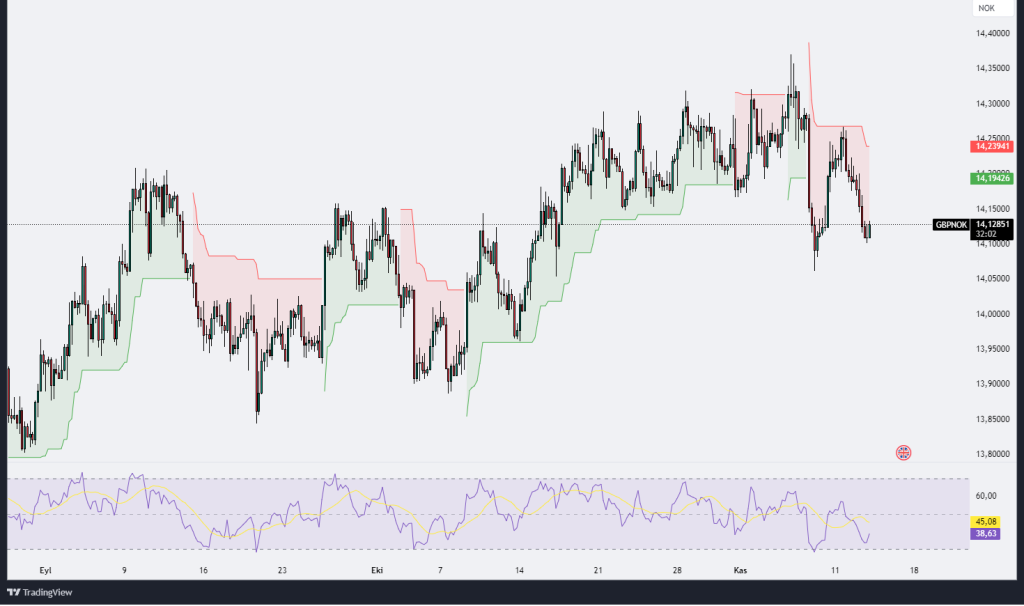
GBPNOK
The GBP/NOK chart demonstrates a downward movement as the pair faces resistance at higher levels, currently trading around 14.12852. Recent price action has shown a rejection near the 14.23 level, where the red Ichimoku cloud above signals bearish pressure. The price has moved below a previous consolidation range, suggesting that sellers are in control. The Ichimoku cloud’s color and positioning indicate an active bearish trend, with the red cloud limiting upward movements. On the RSI, which sits around 45.08, there is a lack of bullish momentum as it remains below the 50-neutral line, leaning towards bearish territory. The volume appears relatively stable, but the overall lack of a strong breakout or volume spike reflects indecision in the market. Should the price sustain below 14.15, it could signal a continued move toward lower support levels, potentially testing the 14.00 psychological support or further declines if sellers maintain control. In contrast, a decisive push above the Ichimoku cloud and resistance at 14.23 could shift momentum back towards the bulls, although current technical indicators show a bearish leaning.
.png)

.png)


