
Technical Analysis 14.10.2024
EURUSD
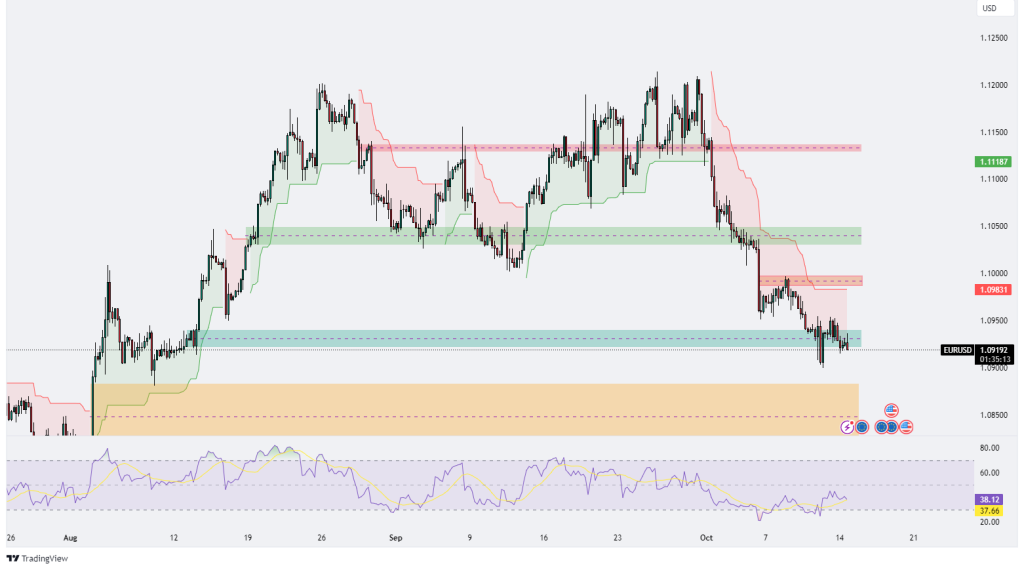
The EUR/USD chart is currently exhibiting a bearish trend, with the price facing strong resistance at the 1.0983 level and testing a key support zone around 1.0919. The presence of a red Ichimoku cloud above the price indicates continued bearish momentum, though the thinning cloud suggests the possibility of consolidation or a weakening of the downward pressure. Additionally, the RSI is hovering around 38, nearing oversold territory, and showing signs of bullish divergence, which may hint at a potential reversal or correction in the near term. Despite the overall bearish structure, marked by lower highs and lower lows, a break below the 1.0919 support could lead to further downside, while a push above the 1.0983 resistance may challenge the current bearish outlook. Traders should closely monitor the price action around these critical levels for confirmation of a reversal or continuation of the downward trend.

GBPUSD
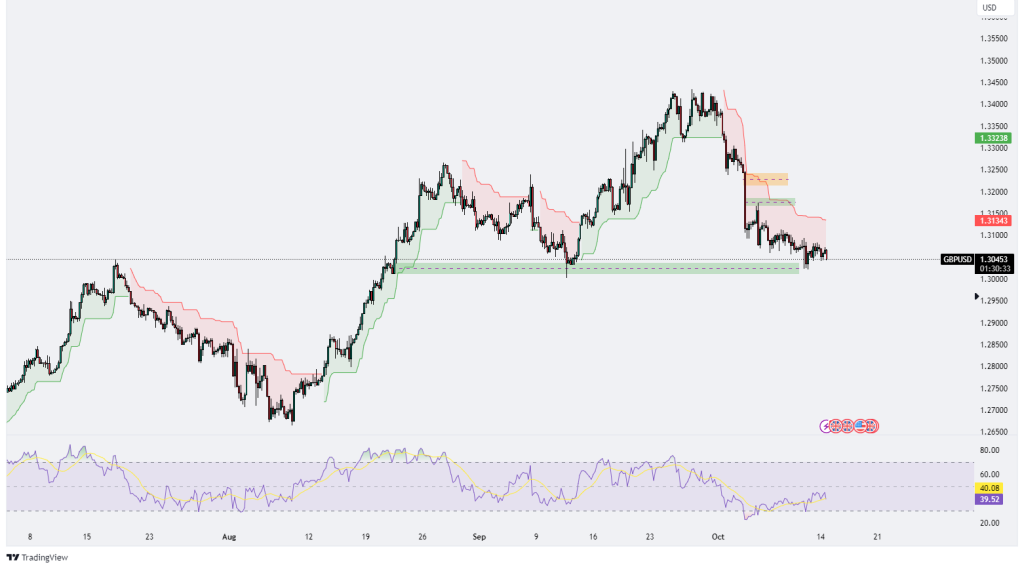
The GBP/USD pair is currently in a bearish trend, with the price testing a key support level around 1.3050, which has held multiple times in the past. Immediate resistance lies at 1.3134, with a stronger resistance zone at 1.3323. The Ichimoku cloud indicates continued downward momentum, as the price remains below it, although the thinning of the cloud suggests that bearish pressure may be weakening or consolidation could be near. The RSI is hovering around 40, indicating that the market is not yet oversold but is approaching that territory. While the overall trend remains bearish, the support at 1.3050 could hold, potentially leading to a short-term bounce towards the 1.3134 resistance. However, a break below this key support would likely lead to further downside pressure in the near term.
XAUUSD
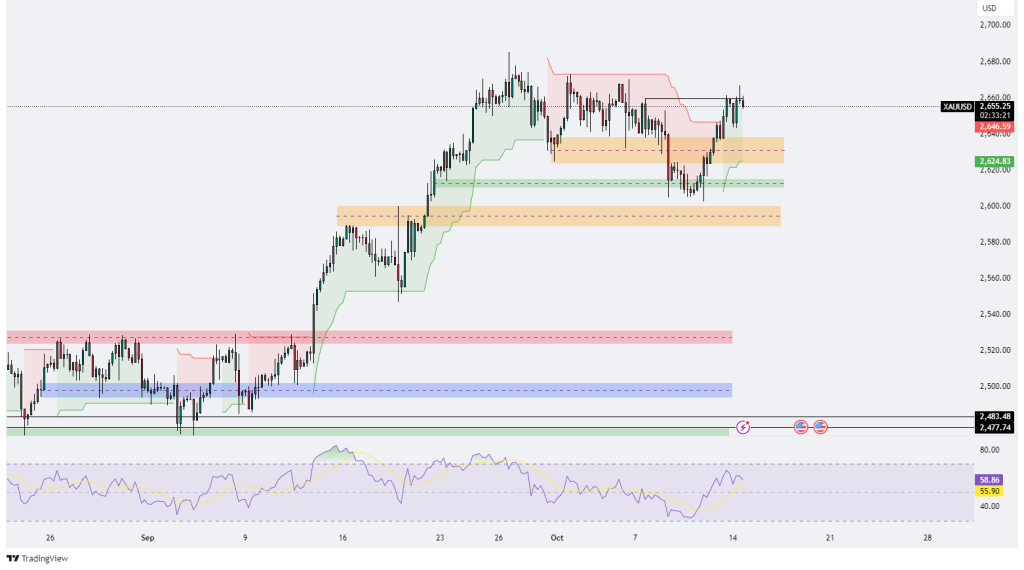
The XAU/USD pair is currently testing a significant resistance zone around 2,655-2,660, where price has historically struggled to break through. While the overall trend remains bullish, with the price making higher highs and higher lows since mid-September, the current resistance level is critical. The Ichimoku cloud suggests lingering bearish pressure as the price hovers near the cloud, indicating a potential for consolidation or a pullback. The RSI, currently at 58, shows mildly bullish momentum but hints at weakening as it flattens near this resistance. If the price breaks above the 2,660 level, it could signal further upside, while a rejection could lead to consolidation or a retracement toward the 2,624 support zone. Traders should watch closely for a break or rejection at these key levels to confirm the next move.
XAGUSD
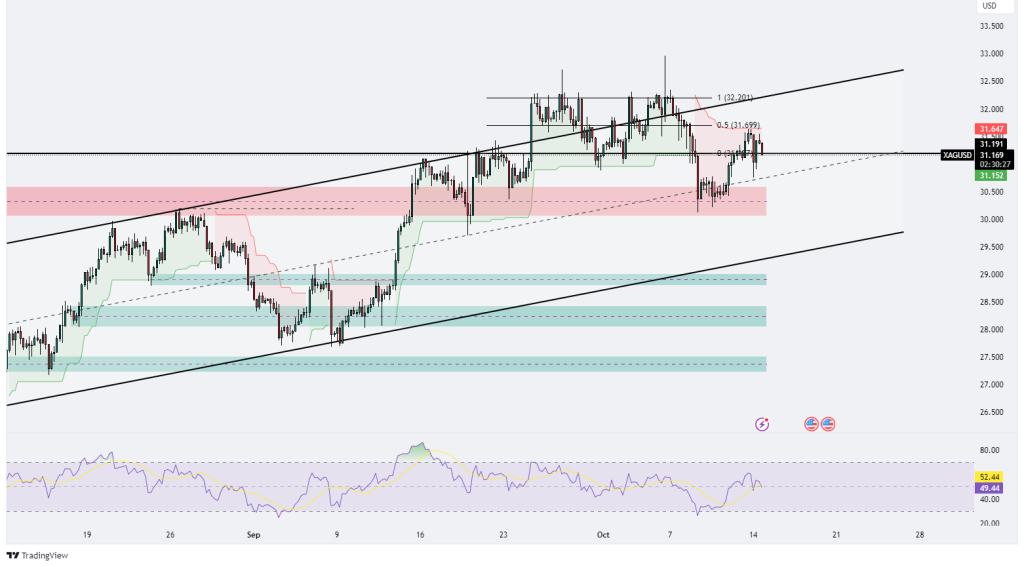
The XAG/USD pair is currently trading within an ascending channel and is testing a key resistance level around 31.647, which aligns with the 50% Fibonacci retracement at 31.699. While the overall trend remains bullish, characterized by higher highs and higher lows, the price is facing resistance at these levels. The RSI is around 52, indicating neutral momentum, and suggests the potential for either a breakout or consolidation. If the price fails to break above the resistance zone, a retracement toward the support at 31.152 or even down to 30.500 is possible. However, if it manages to break through this resistance, the next target could be the 61.8% Fibonacci level around 32.201. Traders should closely watch the price action at these critical levels for a clearer direction.
.png)

.png)


