
Technical Analysis 15.10.2024
EURGBP
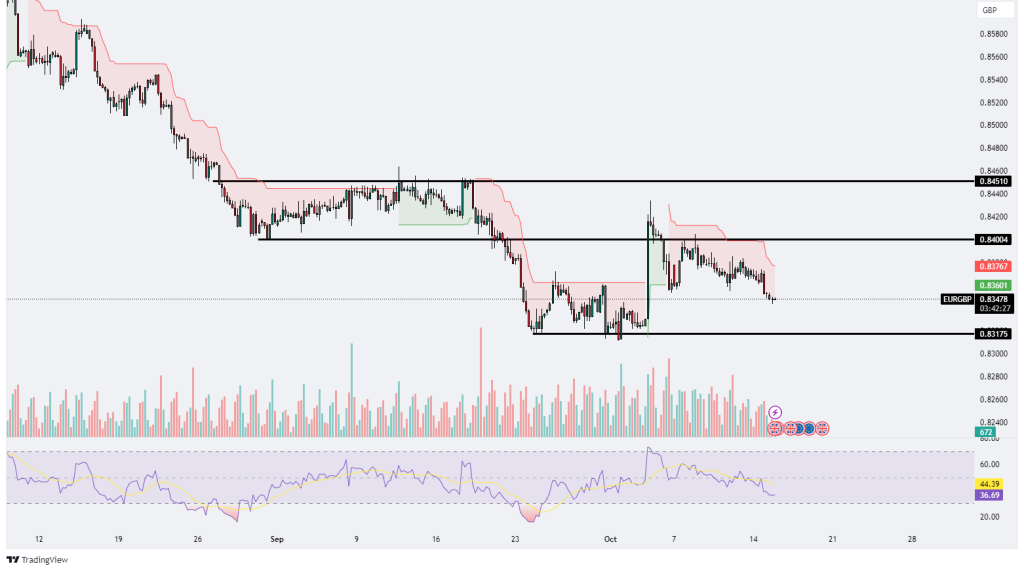
The EUR/GBP chart exhibits a strong downtrend that has persisted over time, marked by well-defined support and resistance levels. The resistance levels at 0.84510 and 0.84004 have held firm, preventing any sustained upward movements. On the downside, the key support level stands at 0.83175, which has so far acted as a barrier to further declines. This price action shows that the market is consolidating after a significant drop, with the price moving sideways between these support and resistance zones, creating a range-bound market.
From a technical perspective, the price is currently trading below the Ichimoku cloud, which is a clear indicator of bearish momentum. The fact that the price is unable to break above the cloud confirms that sellers remain in control, and the bearish trend is likely to continue unless the price re-enters the cloud or breaks above it. The Ichimoku cloud’s position adds a strong layer of resistance, making any upward movement difficult in the current market environment.
The RSI (Relative Strength Index) is currently at 44.39, which suggests that although the pair is experiencing bearish momentum, it has not yet reached oversold conditions. Typically, a reading below 30 would indicate an oversold market where a potential reversal could occur. However, with the RSI still above this level, there is room for further downside movement before reaching a critical point. The downward slope of the RSI also reinforces the view that sellers remain dominant in the market.
Additionally, the volume in this chart appears to be consistently low, signaling a lack of strong conviction from market participants. Low volume typically suggests that any price moves, whether up or down, may lack the necessary strength to sustain a major breakout or breakdown. This could imply that the market is waiting for a key catalyst, such as a fundamental event or a significant technical breakout, to drive higher volume and more directional movement.
In conclusion, the overall technical outlook for EUR/GBP remains bearish. The pair is struggling to move past the key resistance levels, and the downtrend is likely to persist unless the price can break through 0.84004 or, more significantly, 0.84510. On the downside, a break below the critical support at 0.83175 would likely trigger further declines. The combination of bearish Ichimoku signals, a declining RSI, and low trading volume all support the view that the market is still dominated by sellers, and caution is warranted for any potential reversal until stronger bullish signals emerge.

CADCHF
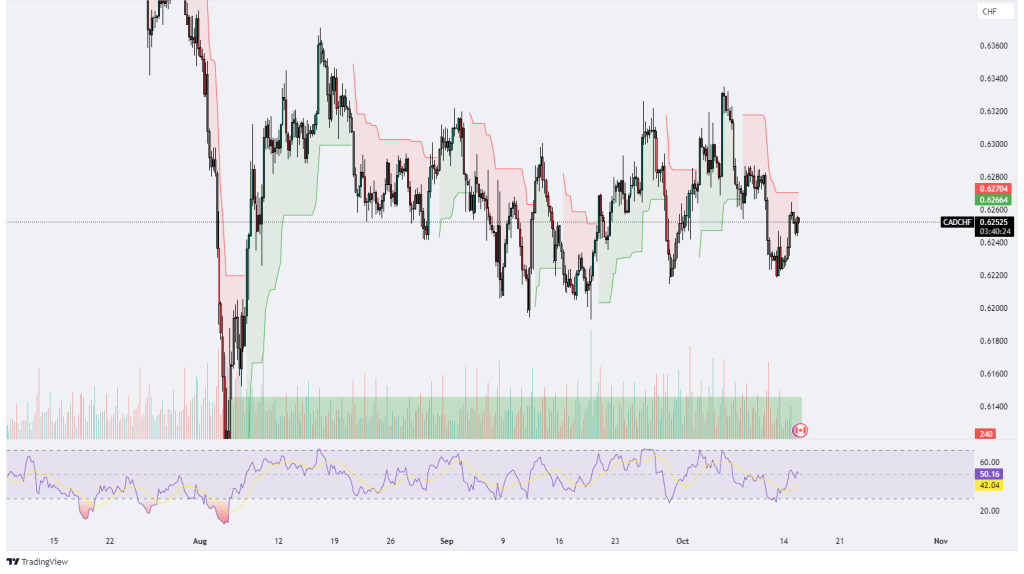
The CAD/CHF chart displays a range-bound price action, indicating a period of consolidation where neither buyers nor sellers have been able to establish a dominant trend. The price has been fluctuating between 0.62700 as resistance and 0.62400 as support, suggesting that the market is currently in a phase of indecision. This is further supported by the presence of the Ichimoku Cloud, with the price currently sitting near the lower boundary of the cloud. Typically, trading below the cloud indicates bearish sentiment, while trading above the cloud signals a potential bullish momentum. In this case, the price is trying to push upward into the cloud, but the lack of a decisive move suggests that the market is still weighing its direction.
The Relative Strength Index (RSI), currently at 50.46, reflects a neutral market sentiment. The RSI level is neither in overbought nor oversold territory, meaning that the price has room to move in either direction without being constrained by extreme market conditions. Recently, the RSI has risen from lower levels around 42.06, which hints at a mild buildup in bullish momentum. However, this upward move in RSI hasn’t been strong enough to signify a clear reversal from the previous bearish phases. Instead, it suggests that the market is in a wait-and-see mode, possibly awaiting a catalyst that could drive the price in a more definitive direction.
The volume on the chart appears to be relatively stable, with no significant spikes that would indicate strong buying or selling pressure. The lack of volume spikes suggests that traders are hesitant to commit to a particular direction at this stage, preferring to observe rather than take large positions. In many cases, a strong breakout or breakdown is often accompanied by a notable increase in volume, but the current low volume indicates that the market is still in a holding pattern, lacking the conviction needed to break out of its current range.
The resistance level at 0.62700 is a key area to watch. If the price can decisively break above this level with increased volume, it could signal a shift toward a bullish trend. This would likely indicate that buyers have gained control of the market, potentially pushing the price higher. On the other hand, the support at 0.62400 has been acting as a floor for the price. A break below this level could lead to increased selling pressure, pushing the price downward and reinforcing the bearish sentiment.
In conclusion, the CAD/CHF pair is currently in a phase of consolidation, moving between well-defined support and resistance levels. The market is showing neutral signals, as reflected by the RSI and the Ichimoku Cloud positioning. The price’s attempt to break into the cloud could indicate a shift in sentiment, but until a decisive move is made, the pair is likely to remain range-bound. Traders will likely be watching for a breakout above 0.62700 or a breakdown below 0.62400 to confirm the next major move. For now, the market remains in a state of indecision, with both bulls and bears awaiting clearer signals to commit to a stronger trend.
EURAUD
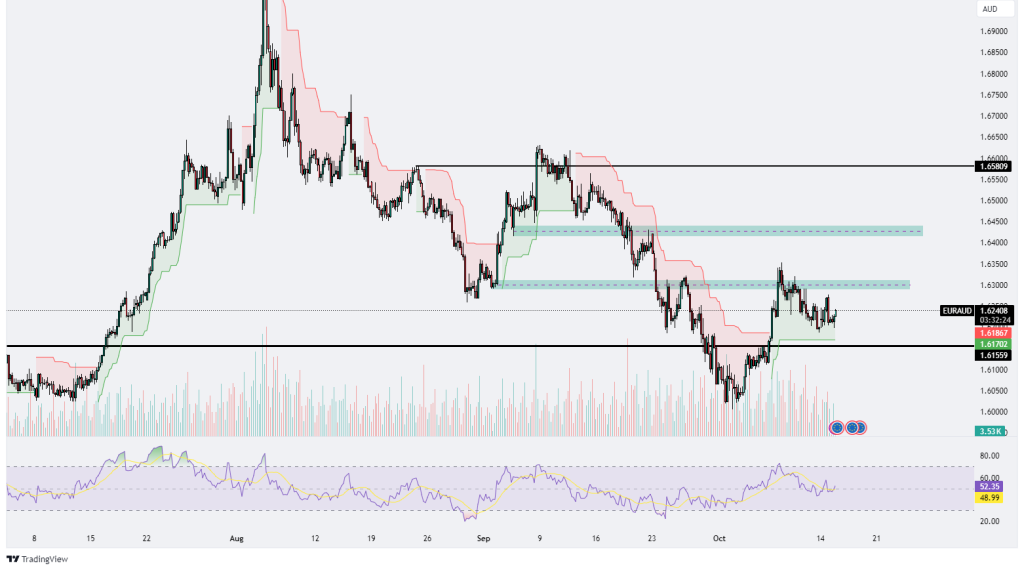
The EUR/AUD chart reflects a period of consolidation following a significant downtrend, with the price currently fluctuating between key resistance and support levels. The major resistance zones are located between 1.64000 and 1.64500, which have acted as barriers to upward movement, with the price being rejected multiple times from these levels in the past. The upper resistance level of 1.658809 marks a significant peak, beyond which the price has struggled to maintain upward momentum. On the downside, strong support is evident around the 1.61559 level, which has consistently acted as a floor, preventing further declines and leading to temporary rebounds in the price.
The overall price action has been bearish for some time, characterized by lower highs and lower lows. However, more recently, the price appears to be attempting a period of consolidation or even a potential reversal, as it has rebounded from the support level and is testing higher levels. The market seems to be in a state of indecision, with the price oscillating between the support and resistance zones, suggesting that traders are waiting for clearer signals before committing to a stronger trend.
One of the key indicators on this chart is the Ichimoku Cloud, which is often used to identify trends and potential reversals. The fact that the price is currently trading within the Ichimoku Cloud indicates that the market is in a period of uncertainty. Typically, when the price is within the cloud, it signals a consolidation phase where neither the bulls nor the bears have a decisive advantage. A break above the cloud could indicate the beginning of a bullish reversal or at least a stronger upward correction. However, if the price remains below the cloud and struggles to break through the resistance levels, the broader bearish trend could continue.
The RSI (Relative Strength Index) is currently sitting at 52.35, which suggests neutral market conditions. This means that the pair is neither overbought nor oversold, allowing room for the price to move in either direction without being constrained by extreme conditions. The RSI has recently ticked up from a lower level around 48.99, suggesting that some bullish momentum may be building, but the market remains undecided as to whether this will be sustained.
Additionally, the volume on the chart is relatively stable, with no significant spikes. This lack of volume indicates that recent price movements may lack strong conviction, and traders are likely waiting for more definitive price action before committing to larger positions. In many cases, significant price breakouts or breakdowns are accompanied by sharp increases in volume, but the current low volume suggests that the market may remain in its consolidation phase until a clear breakout or breakdown occurs.
In conclusion, the EUR/AUD pair is in a period of consolidation following a prolonged downtrend, with strong support at 1.61559 and resistance between 1.64000 and 1.64500. The price is currently trading within the Ichimoku Cloud, reflecting market indecision, and the RSI is neutral, indicating that the market has room to move in either direction. Volume remains low, suggesting that traders are waiting for a clearer signal before increasing their trading activity. If the price can break above the cloud and key resistance levels, it could signal a potential bullish reversal. However, failure to break through these levels may lead to a continuation of the bearish trend. Traders should watch for a decisive move in either direction, as this could provide a clearer indication of the pair’s next major move.
NZDJPY
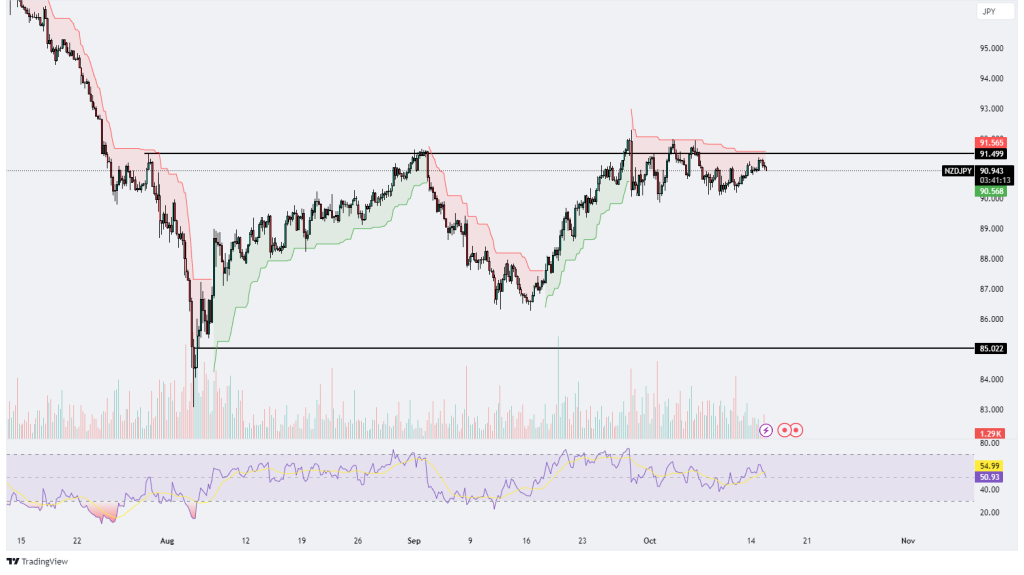
The NZD/JPY chart reflects a broader uptrend that has encountered significant resistance around the 91.565 level. This resistance has proven difficult for the pair to overcome, as several attempts to break above it have resulted in rejections, causing the price to pull back and enter a period of consolidation. The current consolidation phase suggests that the bullish momentum, which had driven the pair upward from its lows around 85.022, has weakened. However, the immediate support level at 90.568 has so far prevented a more significant decline. If this support level is broken, the price could potentially move lower to test the next key support levels, which may be around the 88.00 or 87.00 areas.
The Ichimoku Cloud provides additional insight into the market dynamics. Although the price is still trading above the cloud, indicating that the overall market sentiment remains bullish, the cloud has begun to thin out, suggesting a reduction in volatility and momentum. A thinning cloud often precedes a change in trend, and if the price falls below the cloud, it could signal a shift from bullish to bearish sentiment. Traders should keep a close eye on whether the price remains above the cloud or if it begins to break through to the downside, which could confirm a reversal.
The RSI (Relative Strength Index), currently at 48.30, reflects a market in indecision. It is hovering just below the neutral 50 level, indicating that neither buyers nor sellers are in control. This suggests that the pair may continue to trade within its current range unless there is a decisive move that pushes the RSI higher or lower. The RSI’s previous upward movement toward 54.80 indicated some bullish momentum, but its subsequent decline points to a loss of strength among the bulls. If the RSI continues to fall, it could indicate increasing bearish pressure, while a rise above 50 could signal a potential resumption of the uptrend.
Volume analysis shows a declining trend, suggesting a lack of strong conviction behind recent price movements. When volume decreases during consolidation phases, it often means that traders are waiting for clearer signals before making significant moves. This is consistent with the market’s current indecision, as both bulls and bears seem hesitant to fully commit. A breakout from the consolidation phase, whether upward or downward, is likely to be accompanied by a spike in volume, confirming the direction of the next major move.
In conclusion, the NZD/JPY pair remains in an overall uptrend but is currently struggling to break through the key resistance level at 91.565. The price is consolidating, with immediate support at 90.568, and a break below this level could trigger further declines toward the 88.00 region. The Ichimoku Cloud shows weakening bullish momentum, and the RSI reflects market indecision, with neither buyers nor sellers having a clear advantage. Declining volume further supports the view that the market is waiting for clearer signals before committing to a new direction. If the price can break above 91.565, it may resume the uptrend, but failure to do so could lead to further consolidation or even a reversal toward lower support levels. Traders should watch for a decisive move either above resistance or below support to confirm the next major trend.
.png)

.png)


