
Technical Analysis 15.11.2024
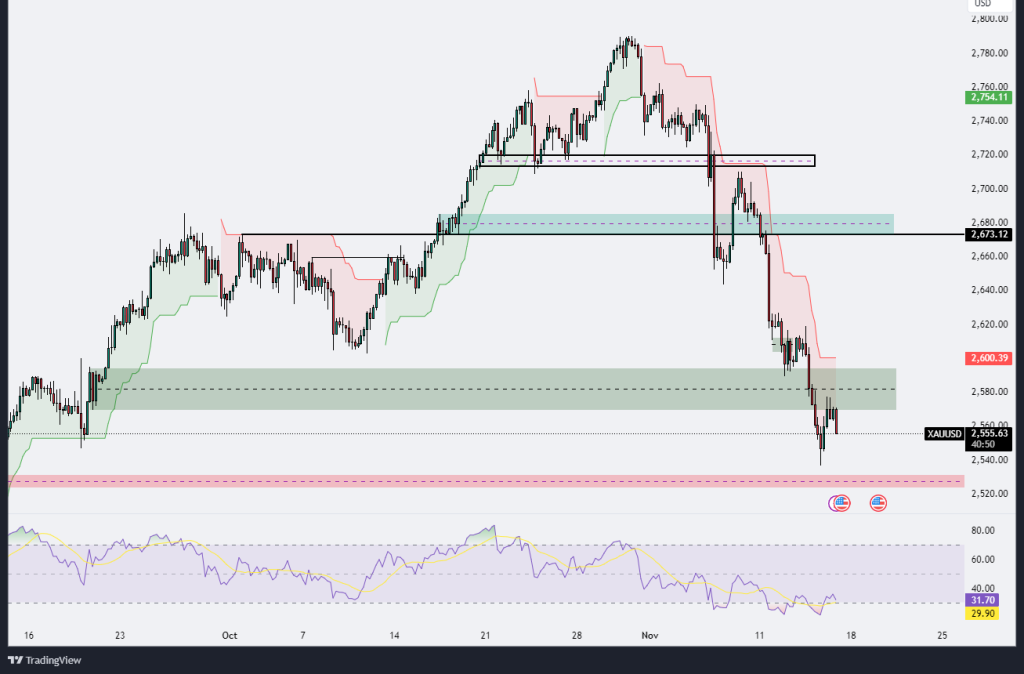
XAUUSD
The XAU/USD (Gold) chart reflects a bearish trend in recent weeks, with the price experiencing a sharp decline from around 2,750 to the current level near 2,555.65. This downward movement has been characterized by consecutive lower highs and lower lows, indicating persistent selling pressure. The Ichimoku cloud above the price action, predominantly shaded red, suggests that bearish momentum remains strong, as the price has stayed below the cloud’s resistance for an extended period. A significant support level was broken near 2,673, turning into resistance as the price tested and rejected it, reinforcing the bearish bias. Another notable resistance zone exists around 2,600, marked by a gray box, where the price briefly attempted a recovery but faced selling pressure once again, pushing it back down. The RSI indicator shows oversold conditions around 29.90, suggesting that selling momentum might be exhausted in the short term; however, it has yet to recover above the midpoint of 50, indicating that any upward movement might still be limited without a strong reversal signal. A key support zone is visible in the green region below the current price, which could act as a potential area of consolidation or reversal if buyers step in. Nonetheless, if the bearish trend continues and this support fails, there could be further declines towards the red-dashed support zone below, indicating a deeper correction. Overall, XAU/USD remains in a bearish environment, with traders possibly watching for signs of a bottom around current levels or preparing for further declines if the trend persists.

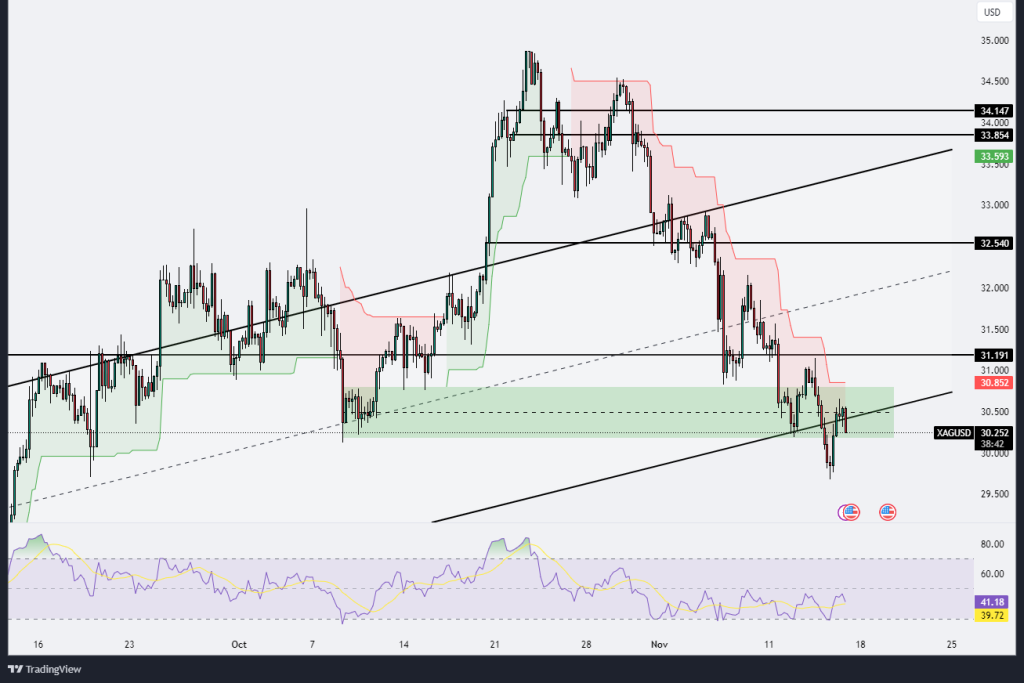
XAGUSD
The XAG/USD (Silver) chart reveals a strong bearish trend over the past few weeks, with prices falling from above 34.00 to the current level around 30.25. This decline has been characterized by lower highs and lower lows, confirming the continuation of a downtrend. The Ichimoku cloud, which appears above the price action in a predominantly red shade, further indicates that bearish momentum remains in control as prices consistently trade below the cloud. A critical support zone between 30.85 and 31.19, highlighted by a green rectangle, has been tested recently, with price action showing signs of a struggle to break decisively below it. This support region aligns with a broader ascending trendline, suggesting it could act as a critical area where buyers might look for a reversal opportunity. However, as the price has already broken below multiple support levels, including the previous uptrend channel, further downside could be expected if sellers maintain pressure.
Notably, the RSI indicator currently hovers around 39.71, which is close to oversold territory but not yet showing a clear reversal signal, implying that bearish momentum may still persist. The lower highs on the RSI, paired with similar trends in price action, suggest a weakening of bullish attempts to regain control. Resistance levels around 32.54 and 33.59, marked by horizontal lines, are potential obstacles should a short-term bounce occur. These areas are critical as they coincide with the Ichimoku cloud’s resistance and previous support zones that could now act as resistance on any retracements. Overall, XAG/USD remains in a bearish posture, with key support around 30.85 acting as a potential make-or-break zone for a possible bounce or further decline. If sellers can push below this support level, the price may see additional declines, possibly testing lower support levels around 30.00 or below.
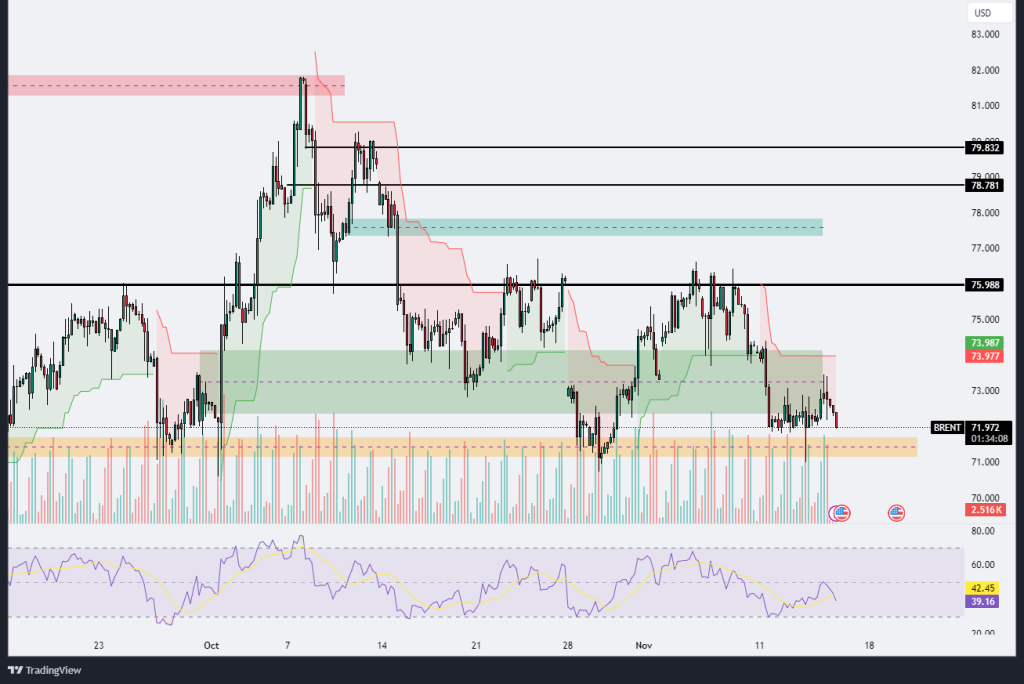
BRENT CRUDE OIL
The chart of Brent Crude Oil shows a gradual downward trend with multiple resistance and support levels being tested and respected over recent sessions. Currently, the price is trading around the 71.97 level, sitting just above a key support zone marked in orange between the 71.50 to 72.00 range. This area has previously acted as a strong level of demand, and buyers may attempt to defend this zone to prevent further downside. However, the bearish pressure is evident, with price action consistently failing to break above the 75.98 resistance level, which has acted as a ceiling for the past few attempts. The Ichimoku cloud, primarily red, reinforces the bearish sentiment as the price remains below this cloud, indicating that downward momentum is intact.
The RSI indicator is currently around 39.16, suggesting that the asset is approaching oversold conditions, although there is no clear sign of a reversal just yet. If the RSI dips further, it may provide a signal for potential buyers looking for a short-term entry. The volume profile also shows a decrease in buying volume, reflecting weakening demand. If the support at 71.50 is broken, Brent could potentially drop to lower support levels around 70.00 or even lower, reflecting further bearish momentum. Conversely, if buyers regain control and push the price back up, the levels around 73.98 and 75.98 will act as significant resistance, where previous selling pressure may emerge again. In summary, Brent Crude Oil is in a precarious position, with a bearish trend prevailing, yet a strong support zone below that could lead to either a consolidation phase or a reversal if buyers step in forcefully.
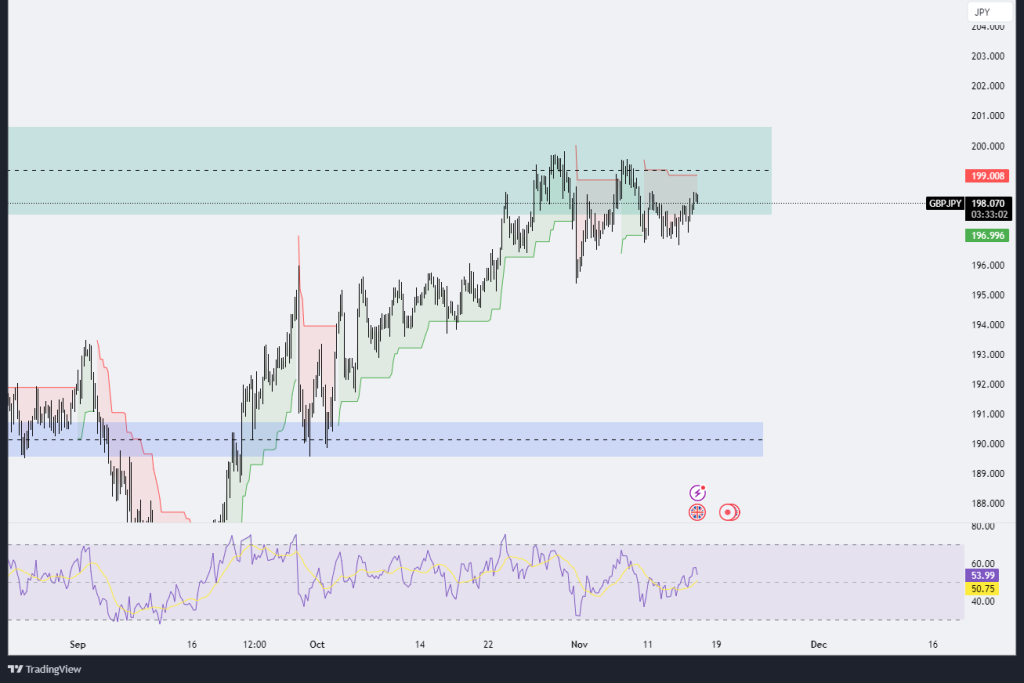
GBPJPY
The GBP/JPY chart shows a recent bullish momentum, with the pair steadily approaching the major psychological resistance level at 199.00. This level has been tested multiple times, as indicated by the strong resistance zone highlighted in green, but has not been decisively breached. The pair has encountered significant selling pressure near this level, suggesting that it is a critical resistance area where sellers are active. The Ichimoku cloud, mostly green below the current price, indicates that the medium-term bullish momentum is still intact, though price consolidation near the resistance suggests some hesitation from buyers to push higher without more confirmation.
On the downside, support is likely around the 196.99 level, which has previously acted as a springboard for upward movements. A failure to hold above this support could signal a pullback toward lower support zones, particularly near the 195.00 mark. The RSI indicator sits at around 50.75, suggesting a neutral stance, neither overbought nor oversold, but with a slight upward bias. This reading aligns with the price’s current position near a critical resistance zone, indicating the potential for either a breakout if momentum increases or a reversal if selling pressure intensifies.
In summary, GBP/JPY is in a pivotal position. A clear break above the 199.00 resistance could open the path for a move toward higher levels, possibly testing the psychological 200.00 mark. However, if the pair fails to break this level, we may see a pullback toward the support zone near 196.99 or even lower, as buyers look for fresh momentum to attempt another breakout.
.png)

.png)


