
Technical Analysis 16.10.2024
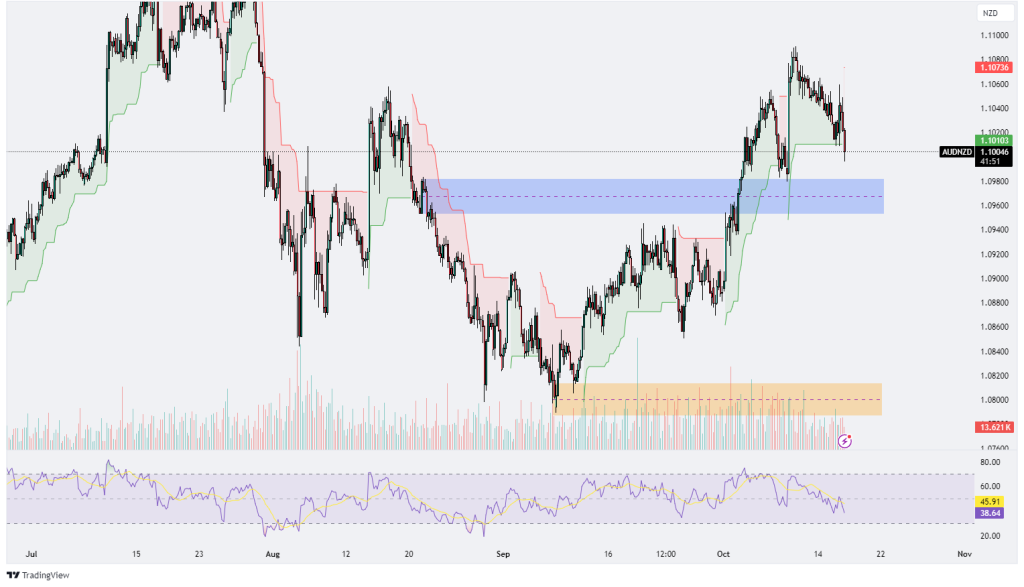
AUDNZD.
The AUD/NZD chart shows a recent pullback after reaching a high of 1.10736, with the current price sitting at 1.10043. The price is approaching a key support zone between 1.09500 – 1.09800, which previously acted as resistance before being broken. If this level holds, it could serve as support, but if it fails, the price may head towards the lower support zone near 1.08200 – 1.08500. The Ichimoku Cloud (Kumo) shows a bullish trend overall, though recent price action has dipped below the resistance level, suggesting some weakness. The RSI is at 45.91, indicating a neutral to slightly bearish condition, with no signs of overbought or oversold extremes, hinting that the pullback may not yet be over. A recent volume spike suggests increased selling pressure, aligning with the current correction. The general outlook suggests the price may continue to pull back further before any bullish resumption, especially if the key support at 1.09500 is breached.

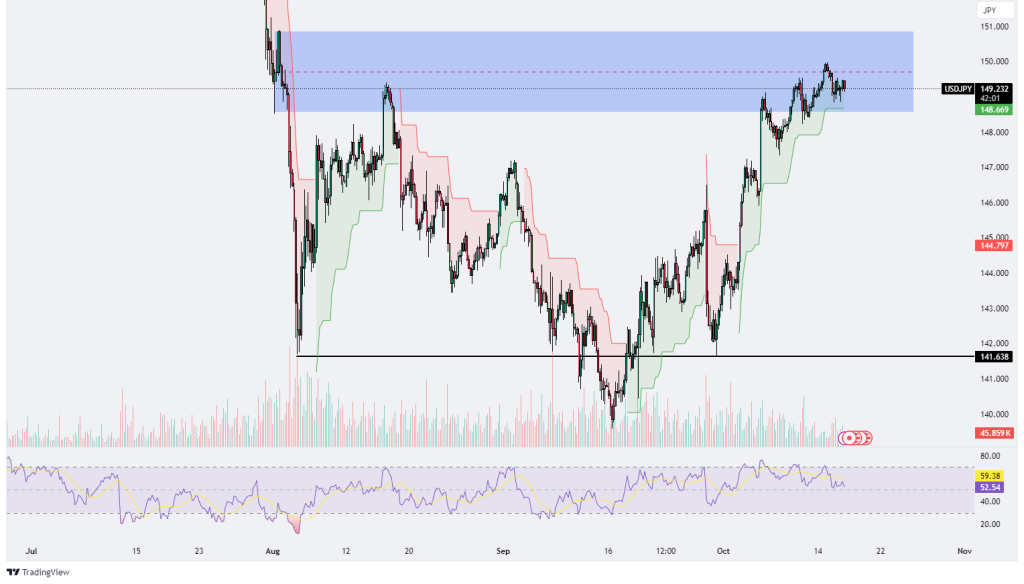
USDJPY
The USD/JPY chart is currently trading at 149.223, near a key resistance zone between 148.500 – 150.000, which the price has tested multiple times without a convincing breakout. This area represents strong selling pressure, while the 141.638 level below serves as a significant support zone from a prior downtrend. The Ichimoku Cloud indicates a prevailing bullish trend as the price remains above the cloud, though consolidation near the resistance suggests a potential breakout or rejection soon. The RSI at 59.37 reflects bullish sentiment but not overbought conditions, while increasing volume indicates heightened market interest. Overall, the pair is at a critical juncture; a breakout above 150.000 could signal further bullish momentum, while rejection at this level could trigger a deeper pullback toward the 141.638 support zone.
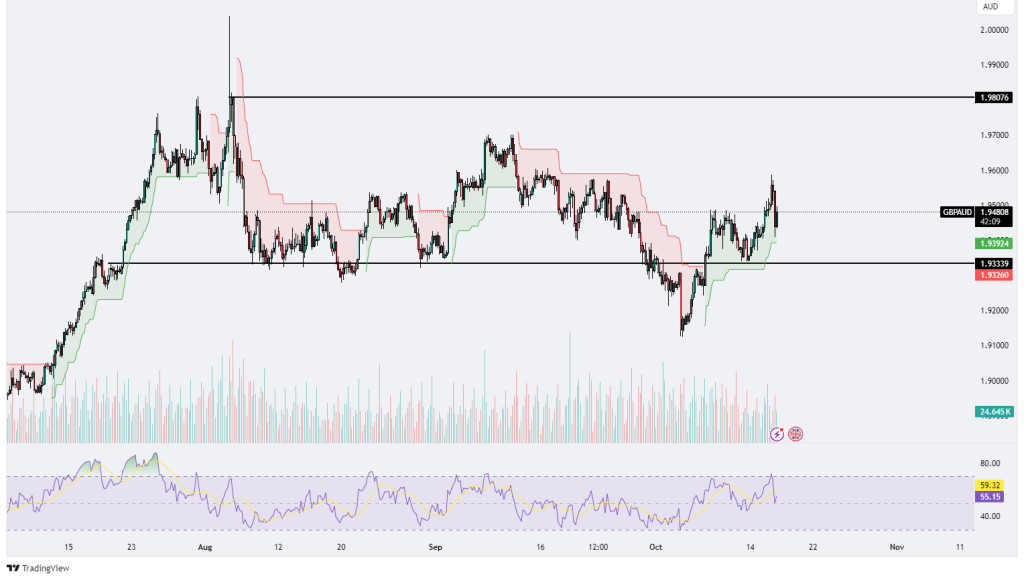
GBPAUD
The GBP/AUD chart is currently trading at 1.94898, showing a recent upward move after bouncing from the 1.93339 – 1.93000 support zone, as marked by the black line. The price has been fluctuating in a range, with strong resistance above 1.95000 and support holding near 1.93339. The Ichimoku Cloud reflects a mixed sentiment, with price moving in and out of the cloud, indicating indecision and consolidation in the market. The RSI is currently at 59.39, signaling a slightly bullish tone but not in overbought territory. The volume has been relatively stable, suggesting balanced market activity. Overall, the price is testing the upper range, and a breakout above 1.95000 could signal further bullish momentum, while a rejection at this level may lead to a retest of the support at 1.93339.
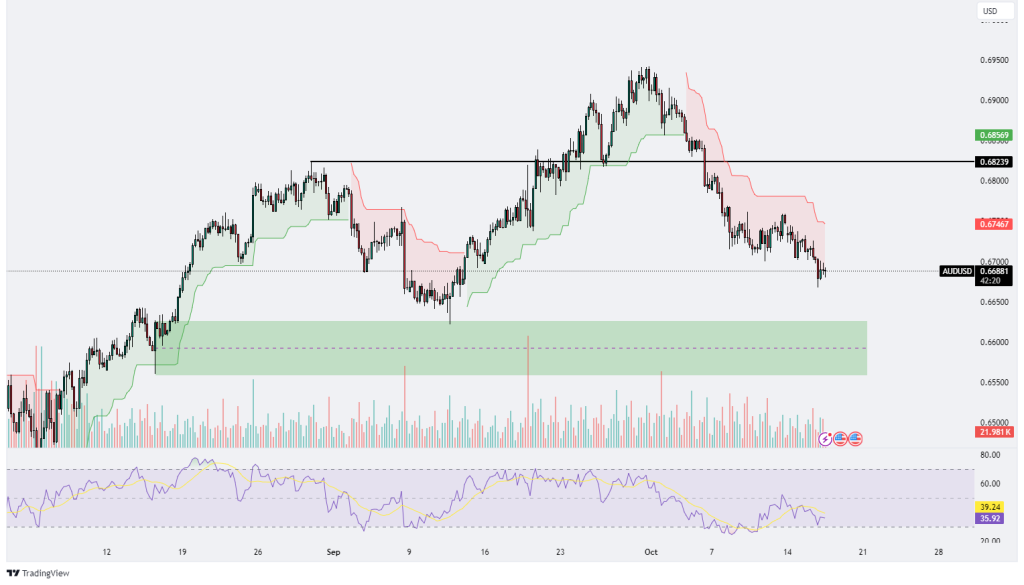
AUDUSD
The AUD/USD chart is currently trading at 0.66856, showing a steady downtrend after reversing from the 0.68239 resistance level. The price is nearing a key support zone between 0.66000 – 0.66500, where previous buying pressure led to upward moves. The Ichimoku Cloud indicates a bearish trend, with the price trading below the cloud and no immediate signs of a breakout. The RSI is at 39.19, approaching oversold territory, suggesting that the downtrend may soon reach exhaustion, potentially leading to a bounce. Volume has been increasing during this downtrend, indicating strong selling pressure. If the 0.66000 support zone holds, the price could rebound, but if it breaks, further declines could follow. Any reversal would face resistance at 0.67467 and 0.68239.
.png)

.png)


