
Technical Analysis 17.12.2024
EURCHF
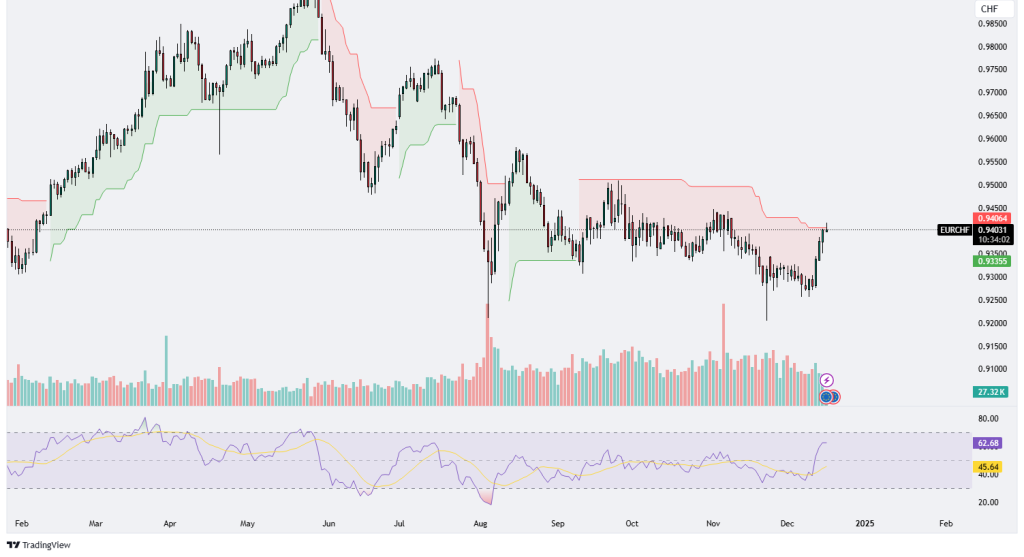
The EUR/CHF chart shows a notable attempt to recover after a prolonged period of consolidation and bearish pressure, trading currently at 0.94031. The pair has bounced back from recent lows near the 0.92500 support level, with buyers pushing prices upward and now challenging the Ichimoku cloud resistance. The red cloud above the price reflects a bearish bias on a longer timeframe, but the upward movement indicates increasing buying momentum, suggesting a potential breakout. For the pair to confirm a trend reversal, it needs a strong daily close above the cloud and the psychological resistance of 0.94500.
Volume analysis indicates heightened activity during the recent upward move, with green volume bars showing increased participation from buyers. This surge in buying interest suggests that bulls are attempting to regain control after months of sideways to bearish action. A sustained break above 0.94500 could trigger further buying, with targets potentially near 0.95000 and beyond, marking the start of a larger upward correction.
The Relative Strength Index (RSI) currently reads 62.68, indicating growing bullish momentum. The RSI has moved above the critical midline (50) and is approaching overbought levels (70). This upward move in RSI aligns with the recent bullish price action, but traders should watch for any bearish divergence, as the RSI is approaching a key area where profit-taking could occur.
Looking back, the broader trend from mid-year shows a significant bearish move that led to a breakdown in August. The price has since struggled to regain traction, forming a prolonged base between 0.92500 and 0.94000. This recent upward push marks one of the first significant attempts to break out of this range. If bulls fail to close above the 0.94500 resistance, a rejection could see the pair retesting support near 0.93355 and possibly returning to the 0.92500 range.
In conclusion, the EUR/CHF is at a critical juncture, with bullish momentum building as the price challenges the Ichimoku cloud resistance. A confirmed break above 0.94500 would signal a potential trend reversal, while failure at this level may lead to renewed bearish pressure. Volume and RSI suggest growing bullish sentiment, but traders should monitor the cloud resistance and key price levels for confirmation of the next directional move.

EURGBP
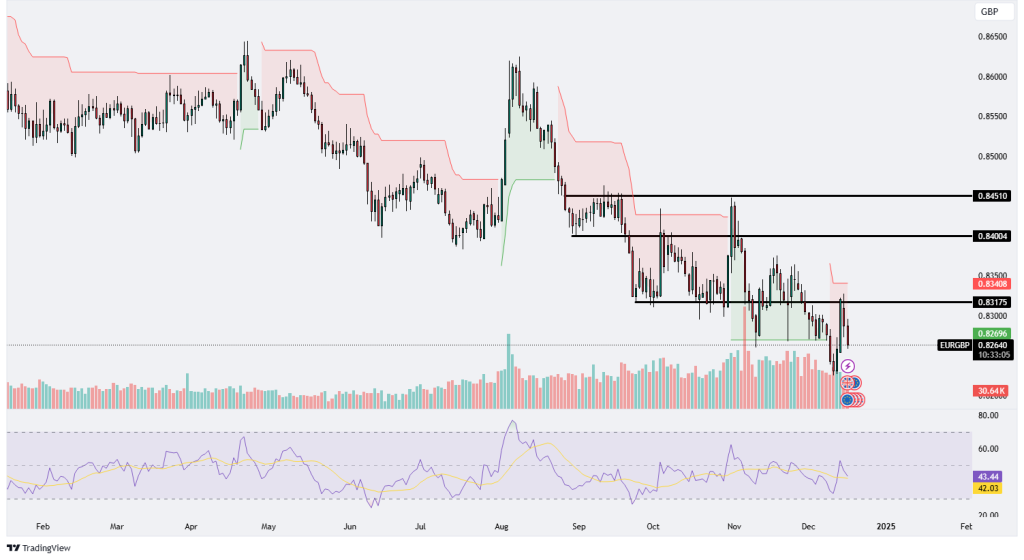
The EUR/GBP chart shows a persistent bearish trend with clear resistance and support levels dictating recent price action. The pair currently trades at 0.82640, struggling to regain upward momentum after testing a multi-month low. This decline reflects the pair’s inability to hold above key resistance levels such as 0.83175 and 0.83408, both of which have acted as strong supply zones in the past few weeks. The downward trajectory intensified as price was rejected from the 0.84004 level, marking a significant failure to shift the broader bearish structure.
Looking at the Ichimoku Cloud, the price remains firmly below the red cloud, signaling that sellers remain dominant. The cloud’s downward slope confirms ongoing bearish sentiment, while the flat bottom edge at higher levels highlights the resistance that bulls must overcome to reverse the trend. If the pair continues to struggle around the 0.83175 mark, further declines could send the price back to test recent lows near 0.82000.
The volume profile shows a spike in selling volume during the recent bearish breakdown, emphasizing strong bearish conviction. However, recent volume spikes have coincided with attempts at bullish recoveries, suggesting buyers are attempting to establish a base, but their momentum remains weak relative to the prevailing downward trend. Sustained volume above current levels will be critical for bulls to attempt a reversal.
The Relative Strength Index (RSI) is currently at 43.44, hovering near oversold conditions but failing to signal strong bullish momentum. Despite a minor bounce from lower levels, the RSI remains below the neutral 50 mark, reinforcing the broader bearish bias. This weak RSI suggests that bulls lack the momentum needed to push prices higher in the short term.
In summary, the EUR/GBP pair remains under heavy bearish pressure, trading below critical resistance levels and under the Ichimoku Cloud. Sellers continue to dominate, with key resistance at 0.83175 and 0.83408 likely capping upward moves. A failure to hold the current level could trigger a renewed test of support near 0.82000, while a breakout above 0.83408 would signal the first sign of bullish strength. Traders should monitor volume and RSI closely for signs of a potential shift in momentum, but the overall trend remains bearish until significant resistance levels are reclaimed.
GBPAUD
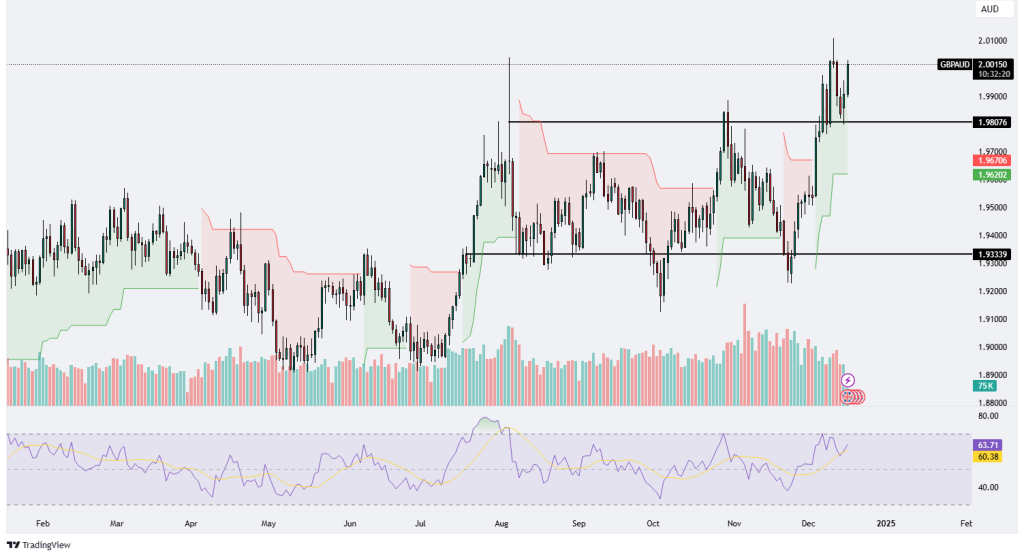
The GBP/AUD pair has shown strong bullish momentum, trading near the psychological level of 2.00150 after breaking above key resistance at 1.98076. This breakout highlights a significant shift in market sentiment, where buyers have taken control after a period of consolidation. The price action reveals a strong upward push, indicating bullish strength that propelled the pair to test higher levels. However, the recent candle hints at some hesitation near the 2.00 psychological level, suggesting potential profit-taking or resistance at this zone.
The Ichimoku Cloud further validates the bullish trend, with the price firmly trading above the green cloud, indicating a continuation of upward momentum. The upward slope of the cloud reinforces the prevailing bullish sentiment, and as long as the pair remains above the cloud, the trend is likely to remain positive. Support now lies at the prior resistance level of 1.98076, which could act as a key retest zone if a pullback occurs.
The volume profile shows elevated buying interest during the breakout phase, with a noticeable increase in volume confirming the strength of the move. This rise in volume signals strong conviction among buyers, and sustained volume above average will be critical to maintain bullish momentum. Conversely, a drop in volume could signal weakening momentum and increase the likelihood of a retracement.
The Relative Strength Index (RSI) currently stands at 63.71, which is in bullish territory but approaching overbought conditions. While the RSI remains above the neutral 50 mark, it suggests that buyers are still in control. However, the slight decline from higher levels hints at some divergence, indicating that momentum could be cooling. If the RSI starts to dip further, it could signal a short-term pullback before any continuation higher.
In summary, the GBP/AUD pair remains in a strong bullish trend, breaking significant resistance levels and trading near the 2.00 mark. Support at 1.98076 will be crucial for bulls to defend in case of a pullback, while resistance near 2.01000 could cap further gains in the short term. The overall trend remains bullish as long as the pair trades above the cloud and maintains strong volume. Traders should watch for signs of continued buying pressure or a reversal signal if momentum weakens further.
GBPCAD
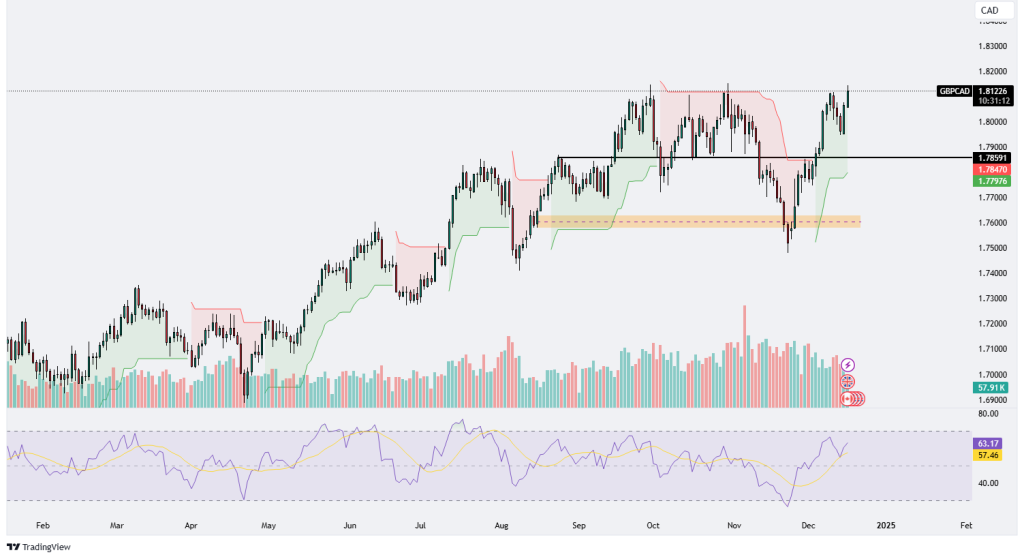
The GBP/CAD chart presents a strong bullish structure, currently trading near 1.81226, a key resistance level after a significant upward move. The price action shows a clear breakout above the previous resistance at 1.78591, signaling robust bullish momentum and indicating renewed buying interest. This breakout comes after a healthy correction in November, where price retraced toward the 1.7600 zone, which acted as a strong demand area (highlighted in orange). Buyers stepped in at this level, leading to a rapid reversal and continuation to the upside.
The Ichimoku Cloud analysis supports the bullish sentiment, as the price is trading decisively above the green cloud, signaling a continuation of the uptrend. The cloud itself is angled upward, reinforcing the prevailing bullish bias. This upward momentum remains intact as long as the price does not fall back into the cloud or below the prior breakout zone of 1.78591, which now acts as immediate support.
Volume analysis reveals a notable uptick in trading activity as the price approached and broke above resistance, confirming strong buyer conviction. Sustained volume at current levels will be crucial to maintaining the bullish momentum. Conversely, any reduction in volume could indicate potential exhaustion among buyers, increasing the risk of a pullback.
The Relative Strength Index (RSI) currently reads 63.17, firmly in bullish territory but not yet in overbought conditions, indicating there is still room for further upward movement. However, traders should monitor RSI closely as a push toward overbought levels (above 70) could signal a short-term pullback or consolidation phase.
In conclusion, the GBP/CAD pair remains in a strong uptrend, breaking significant resistance and maintaining bullish momentum. The 1.78591 level now serves as critical support, and as long as the price holds above this area, further gains toward the 1.8200-1.8300 range appear likely. Traders should watch for sustained volume and RSI behavior for signs of continued bullish strength or potential reversal if overbought conditions develop.
.png)

.png)


