

Technical Analysis 18.10.2024
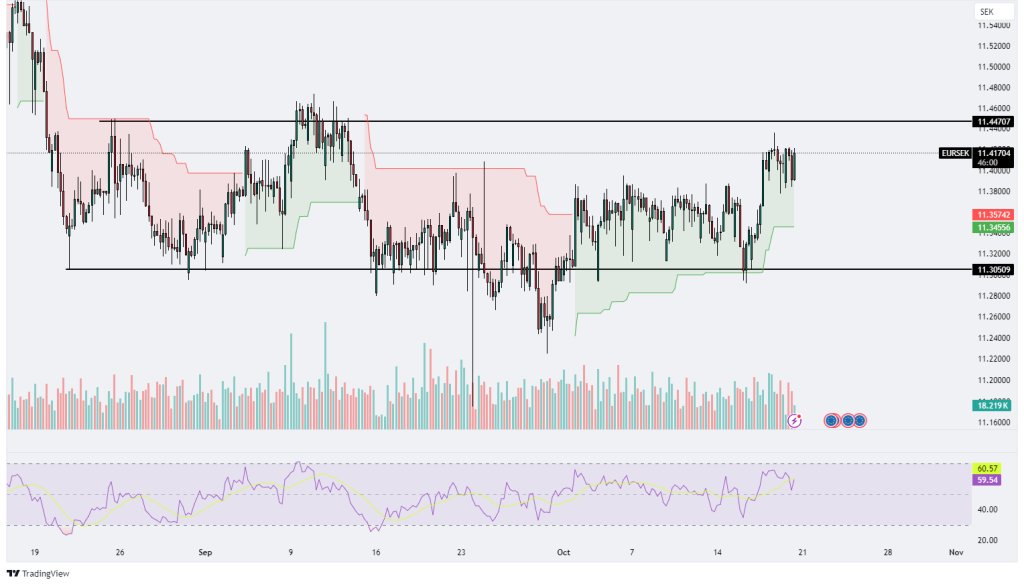
EURSEK
The EUR/SEK chart is currently trading around 11.41706, indicating a consolidation phase within a well-defined range between the resistance at 11.44707 and support at 11.3059. The price has been range-bound for an extended period, repeatedly bouncing between these levels, with the recent rise testing the upper resistance. The Ichimoku Cloud signals a neutral to slightly bullish sentiment, as the price is trading just above the cloud, though its thin structure suggests weak momentum. The RSI, sitting at 60.57, shows slightly bullish conditions but remains far from overbought, indicating room for further upward movement. The consistent volume levels further highlight the consolidation, with no significant buying or selling pressure dominating the market. A breakout above 11.44707 could indicate bullish momentum, while a break below 11.3059 might signal a bearish shift. Traders are likely waiting for a decisive move before committing to new positions.
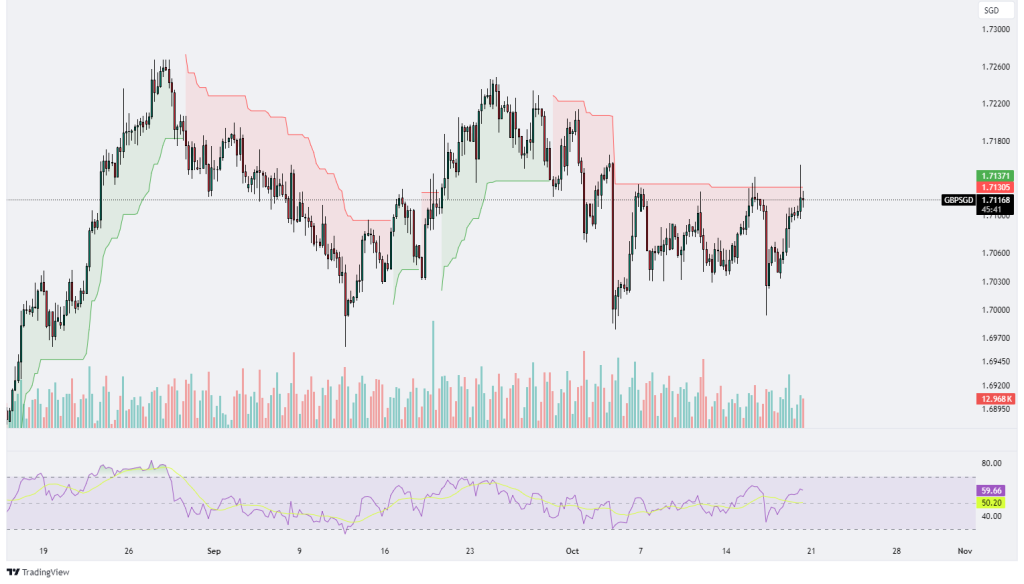
GBPSGD
The GBP/SGD chart is currently trading around 1.71305, with the price testing a key resistance zone between 1.71305 – 1.71700, where it has faced multiple rejections in the past. After a recent bounce from the 1.70300 support level, the price is now attempting to break above this resistance. The Ichimoku Cloud remains bearish, but the price is attempting to push through the cloud, which could signal a shift towards a more bullish trend if sustained. The RSI is at 59.73, reflecting slightly bullish momentum but not yet overbought, indicating potential for further upward movement. Volume remains moderate, suggesting that market participants are cautious at these levels, waiting for a clear breakout or rejection. A successful break above 1.71700 could lead to continued bullish momentum, while a failure to break through this resistance might result in a pullback towards the 1.70300 support zone.
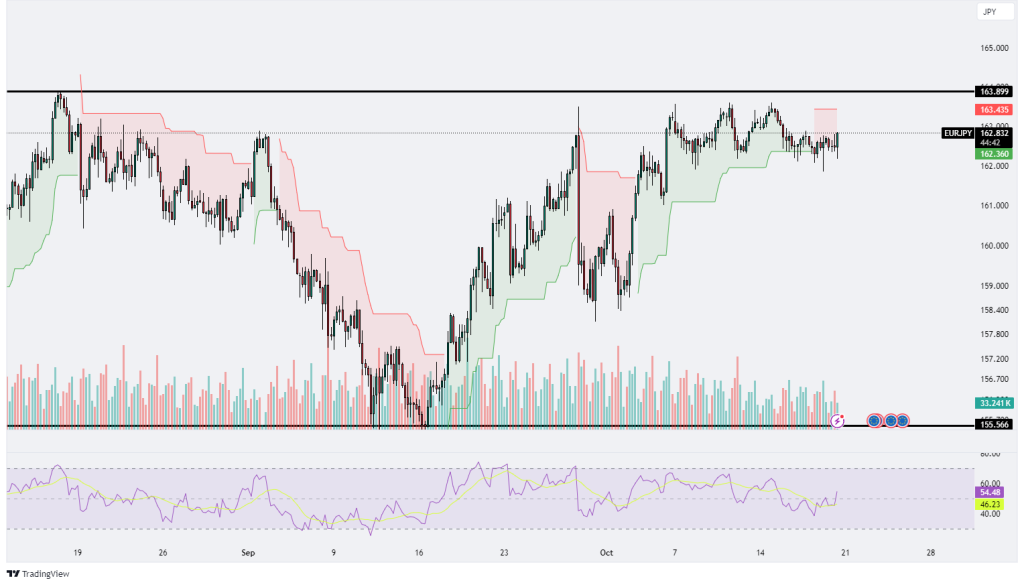
EURJPY
The EUR/JPY chart is currently trading around 162.826, signaling a consolidation phase as the price approaches a key resistance level near 163.899, which has consistently acted as a strong barrier in recent trading sessions. The price has been in an upward trend from a low near 155.566, recovering steadily over time, but now faces significant resistance at 163.899. This resistance level has been tested multiple times, but the price has yet to break above it, indicating that sellers remain active in this area. If the price can successfully break through this resistance, it could signal a bullish breakout, potentially leading to further upside momentum. However, failure to break this level may result in a pullback, with 155.566 acting as the next major support level where the price has previously bounced back strongly. The Ichimoku Cloud shows neutral to slightly bullish conditions, with the price hovering above the cloud, suggesting that the overall bullish trend is still intact, though the cloud’s thin appearance indicates weak momentum, reinforcing the idea that the market is currently consolidating. The RSI at 54.34 reflects a neutral stance, signaling that the market is not overbought and still has room for further movement in either direction. A rise in RSI above 60 could confirm stronger bullish momentum, while a decline below 50 may indicate the start of a bearish correction. Volume has been steady, with no significant spikes, suggesting that traders are cautiously watching for clearer signals before making any major moves. Overall, the market remains in consolidation, and traders should watch for a breakout above 163.899 for confirmation of a bullish continuation or a drop below support for a potential reversal toward lower levels.
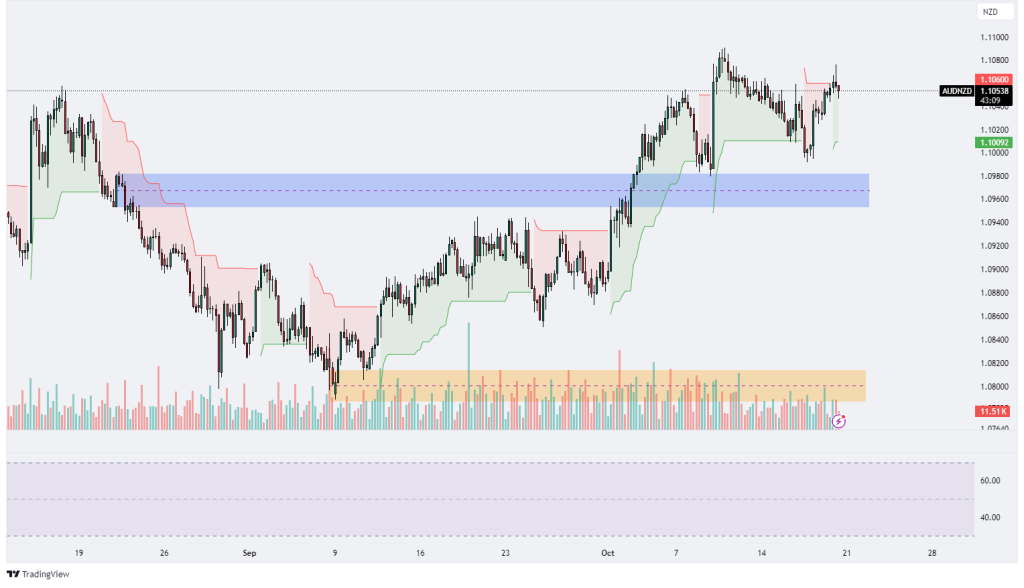
AUDNZD
The AUD/NZD chart is currently trading around 1.10538, showing a strong bullish recovery after bouncing off key support levels in the 1.08500 – 1.09000 range, marked by the orange zone. The price has been in a steady upward trend since mid-September, breaking above the 1.09500 – 1.09800 resistance zone (now acting as support), and is now approaching a key resistance level near 1.1060. This resistance area is crucial as the price has faced challenges breaking through this level, but a successful breakout could lead to further bullish momentum. The Ichimoku Cloud is providing support to the price, indicating a strong upward trend, with the price comfortably trading above the cloud, reinforcing the bullish sentiment. The RSI is at 56.47, reflecting a slightly bullish condition, suggesting that the market has room for more upward movement without entering overbought territory. The RSI’s upward slope supports the idea that buyers still have control, though the market is nearing a crucial inflection point. Volume has remained steady, with no significant spikes, indicating that traders are likely waiting for confirmation of either a breakout above 1.1060 or a rejection at this resistance level before making major moves. If the price fails to break through this resistance, a pullback toward the previous support zone between 1.09500 – 1.09800 could occur. Overall, the market remains bullish, but the price action around 1.1060 will be key in determining whether the uptrend continues or faces a temporary correction.
.png)

.png)


