
Technical Analysis 18.11.2024
EURUSD
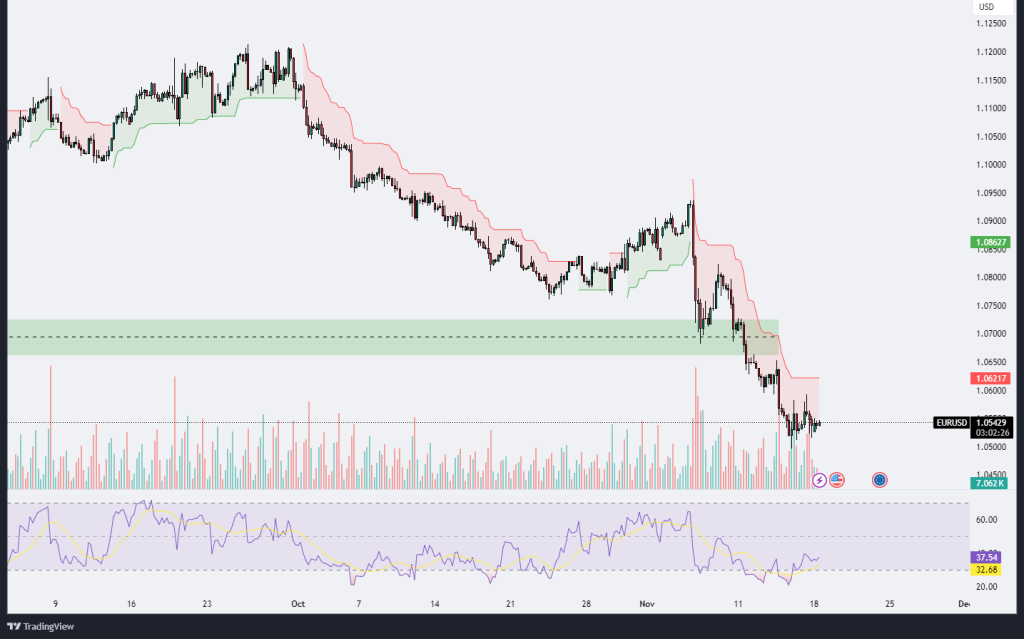
The EUR/USD chart reflects a persistent downtrend as the pair remains firmly below the Ichimoku cloud, indicating bearish sentiment dominates the market. Over recent sessions, the pair has shown signs of consolidation near the 1.0540-1.0620 region, suggesting that the sellers are pausing before deciding on further downside or allowing for a potential correction. Volume has decreased slightly during this consolidation phase, which may indicate reduced selling pressure or a lack of aggressive buying interest. The RSI indicator sits near oversold territory, around the 32-37 range, hinting at a possible short-term relief rally as sellers might be temporarily exhausted.
However, the overall trend remains bearish, with the Ichimoku cloud and the moving averages providing dynamic resistance above current price levels. A key resistance zone is observed near the 1.0620 level, where any attempts at a recovery might face significant selling pressure. On the downside, if the 1.0540 support level fails to hold, the pair could accelerate its decline toward psychological and technical levels around 1.0450. This lower level represents a critical area where buyers may step in to prevent further losses.
In summary, while EUR/USD is consolidating, the dominant trend is bearish. A break below 1.0540 would likely signal further downside, whereas a move above 1.0620 could allow for a corrective rally, potentially testing the upper boundaries of the recent downtrend. Traders should watch for volume spikes and RSI divergence for clues on the next directional move.

GBPUSD
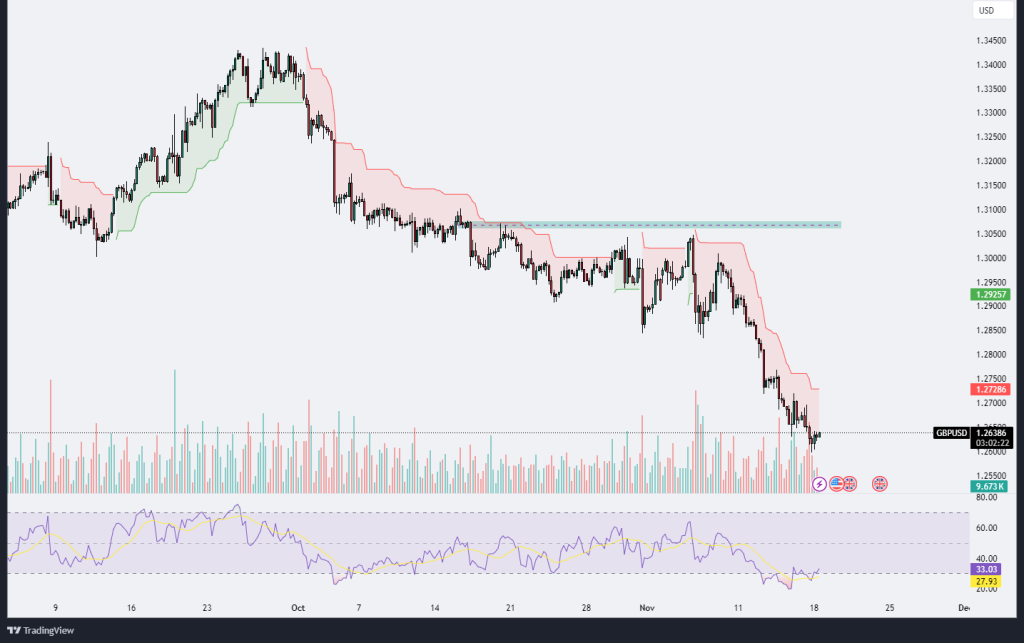
The GBP/USD chart highlights a pronounced downtrend as the pair remains firmly below the Ichimoku cloud, reinforcing the dominance of bearish momentum. The recent price action shows a consolidation near the 1.2630 level after testing lower levels around 1.2550. This region is shaping up as a potential short-term support area, though the broader trend remains negative. The RSI is lingering around the oversold territory at approximately 27-32, suggesting a possibility of a relief rally or some form of consolidation before the next move.
Volume analysis indicates a slight uptick during the most recent selling phases, hinting at strong bearish conviction. Any attempted recovery may encounter stiff resistance near the 1.2780 level, aligned with the Ichimoku cloud and a prior horizontal support-turned-resistance zone. A sustained breakout above this level is necessary to negate the current bearish outlook and open the path toward 1.2900, a critical psychological level.
Conversely, if the consolidation breaks to the downside, the pair could revisit lower support zones around 1.2550 or even 1.2450, aligning with recent price lows. Traders should monitor RSI divergence or changes in volume dynamics to gauge the strength of any potential reversal or continuation of the trend. Overall, while short-term stabilization is possible, the prevailing trend favors the bears unless key resistance levels are reclaimed.
XAUUSD
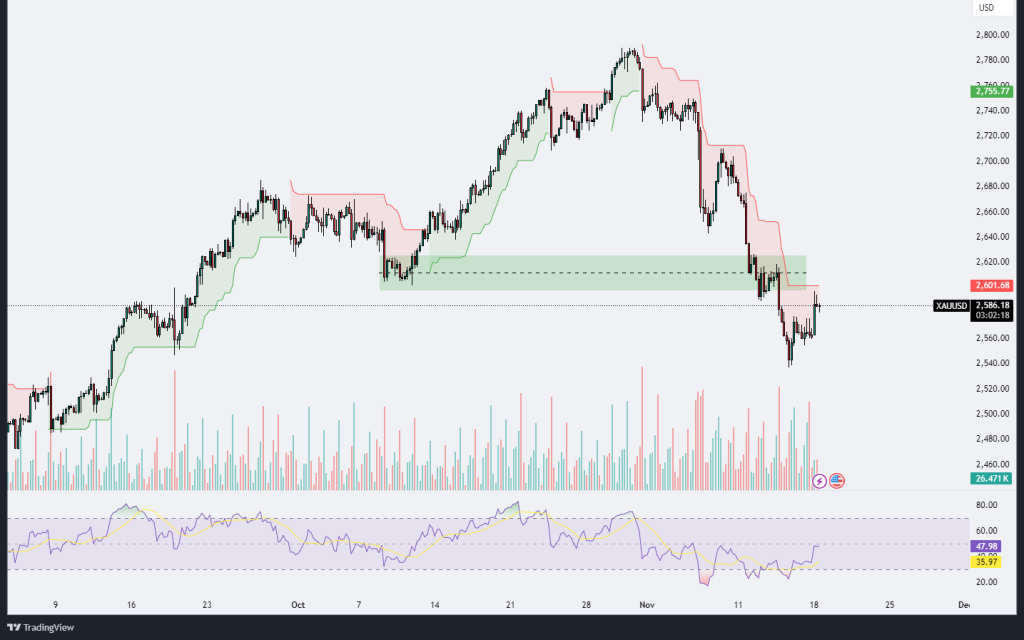
The XAU/USD chart exhibits a significant bearish trend, with price action moving decisively below the Ichimoku cloud, confirming the dominance of sellers. Following a sharp sell-off, the price found support near the 2,550 region, which coincides with a key demand zone, as evident by the increased trading volume. A brief recovery has pushed the price back toward the 2,600 psychological resistance level, where selling pressure has started to re-emerge, indicating that this level could act as a significant barrier to further upside momentum.
The RSI indicator remains below the 50-level, suggesting that the bearish momentum is still intact despite the short-term relief rally. The 2,620-2,640 region above aligns with the Ichimoku cloud’s lower boundary, marking a potential reversal zone where sellers may aggressively re-enter the market. On the other hand, if the bulls manage to push the price above this resistance, it could pave the way for a move toward the 2,680 level, where stronger resistance is likely to emerge.
On the downside, failure to hold above the 2,580 region could accelerate selling pressure, with the next key support around the 2,550 zone. A break below this level could open the door for further declines, potentially targeting the 2,500 psychological support. Volume analysis shows a surge during the recent bearish move, reinforcing the strength of the downtrend. Traders should monitor volume spikes and RSI divergence for early signs of reversal or continuation, with a cautious eye on the 2,600 resistance and the broader trend’s bearish bias.
XAGUSD
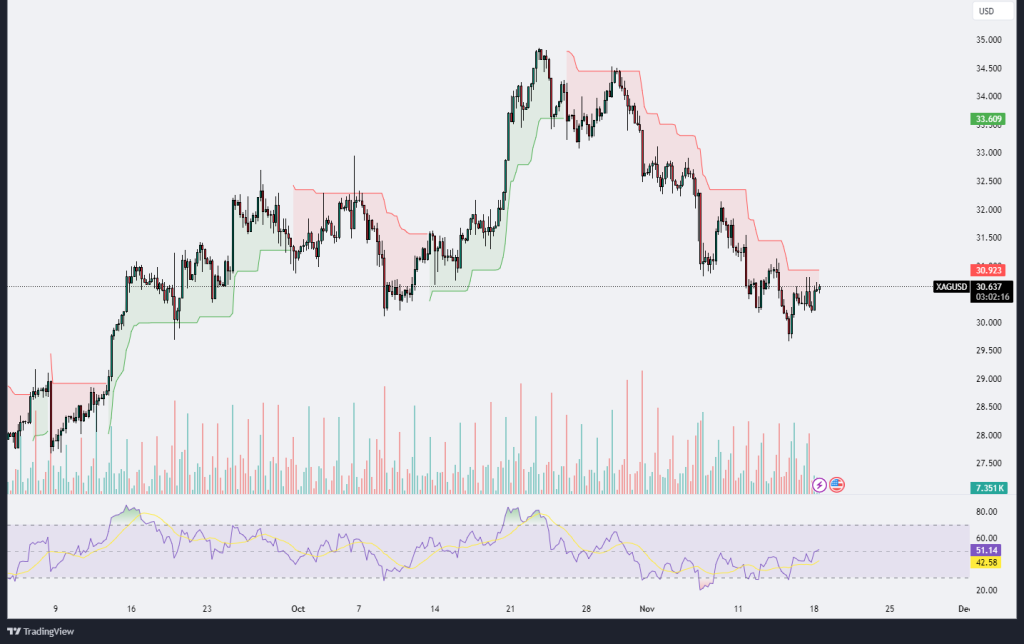
The XAG/USD chart reveals a clear bearish trend as the price has consistently remained below the Ichimoku cloud, signaling sustained selling pressure. After a steep decline, the price has stabilized near the $30.50 region, suggesting the presence of strong support at this level. However, the recovery attempts have been limited, with the price struggling to break above the $30.92 resistance, which aligns closely with the lower boundary of the Ichimoku cloud. This area is likely to act as a significant barrier, as it represents a confluence of technical resistance zones.
The RSI indicator remains below 50 but shows slight upward movement, hinting at a possible momentum shift. However, the absence of a clear breakout above the $30.92 level indicates that the bearish bias remains dominant for now. Trading volume has slightly declined during the consolidation phase, suggesting that the market is in a wait-and-see mode, potentially awaiting a catalyst for the next directional move.
If the price fails to break above $30.92, sellers may reassert control, potentially driving the price back toward the $30.50 support or even lower, targeting $30.00 as the next psychological level. Conversely, a sustained break above $30.92 could trigger a relief rally toward $31.50, where stronger resistance from previous price action and the Ichimoku cloud lies. Traders should closely monitor volume spikes and RSI divergence for signs of a potential breakout or continuation of the downtrend, with an emphasis on the $30.92 resistance level as a critical pivot point.
.png)

.png)


