
Technical Analysis 18.12.2024
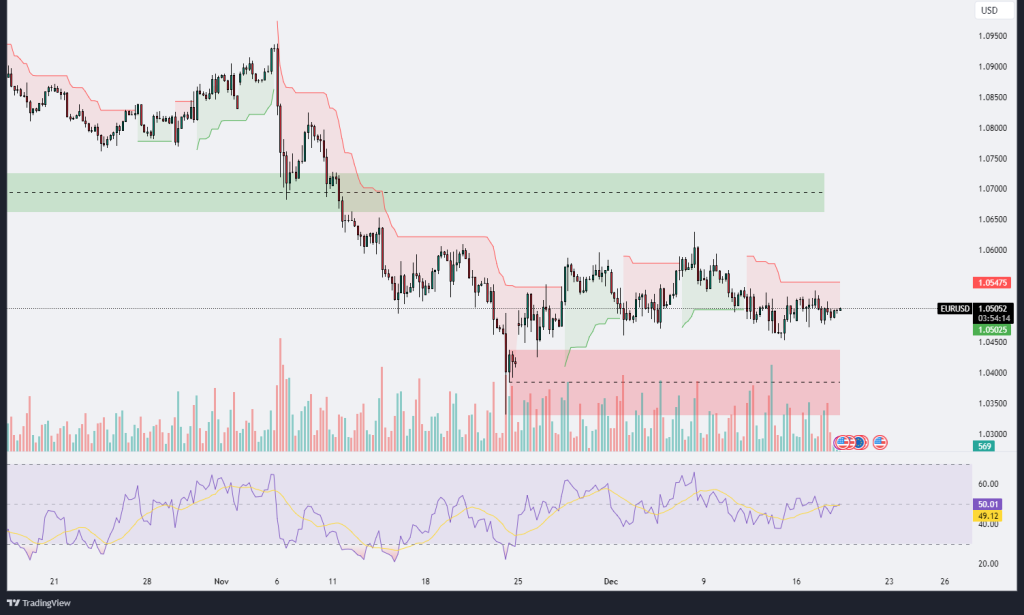
EURUSD
The EUR/USD chart reflects a range-bound market environment, trading at approximately 1.05051. The pair is sandwiched between a resistance zone near 1.05475 and a significant support area around 1.04500, marked in red. Price action has struggled to gain upward momentum, consolidating sideways for several weeks after the sharp downtrend that occurred earlier in November. This suggests a lack of strong directional bias, with sellers dominating near resistance and buyers stepping in at the lower end of the range.
The Ichimoku Cloud indicates a neutral to slightly bearish outlook. The price remains below the cloud, and the cloud itself is flat, signaling no clear trend direction. Any sustained break above the cloud would be a bullish signal, but until that happens, sellers may continue to dominate near resistance levels. On the other hand, a clean break below 1.04500 would open the door for further downside, potentially testing levels below 1.0400.
The volume profile reveals relatively low activity, indicating weak conviction from both buyers and sellers. However, notable spikes in volume occurred near the support zone, suggesting that buyers are defending this area. If volume begins to increase near resistance, it could signal a breakout attempt.
The Relative Strength Index (RSI) is currently at 50.01, which is neutral, neither overbought nor oversold. This aligns with the range-bound price action. Traders should watch for RSI to break above 60 or fall below 40, as this could indicate increasing bullish or bearish momentum, respectively.
In conclusion, EUR/USD remains trapped in a range between 1.04500 and 1.05475, with no clear trend direction. A decisive breakout above resistance could lead to a retest of the green supply zone near 1.07000, while a breakdown below support could trigger further declines. Traders should monitor volume and RSI closely for signs of directional bias, while also considering Ichimoku Cloud dynamics for additional confirmation. Until a breakout occurs, the range-bound behavior is likely to persist, offering short-term trading opportunities within the established support and resistance levels.

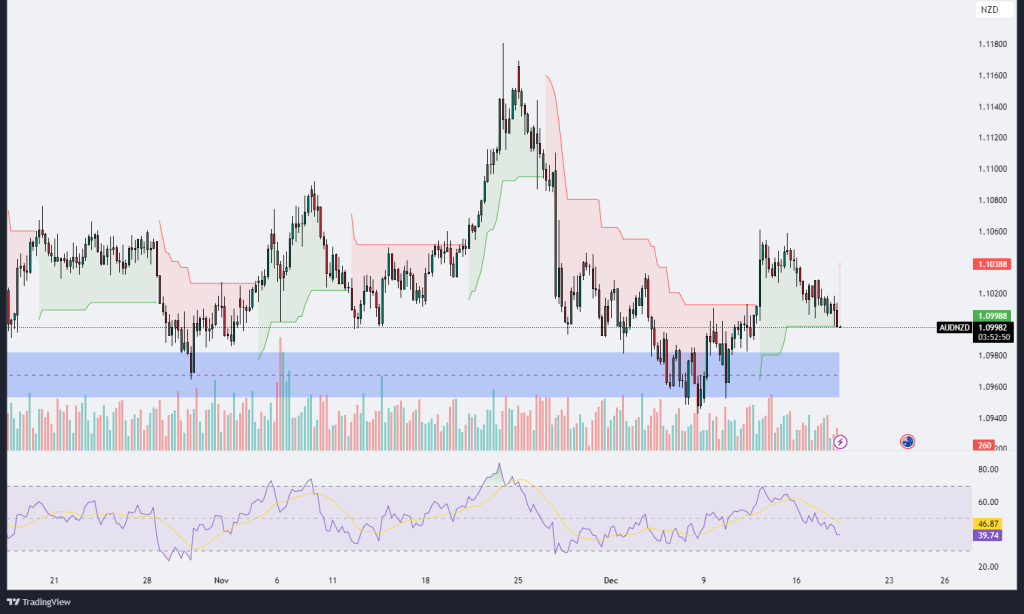
AUDNZD
The AUD/NZD chart reflects a mixed market sentiment, with the price currently trading around 1.09982. The pair is hovering near a key support area marked by the blue zone, which lies between 1.09600 and 1.09800. This level has been tested multiple times over the past few weeks, indicating strong buying interest at the lower boundary, while the resistance at approximately 1.10388 has acted as a ceiling for price rallies.
The Ichimoku Cloud suggests a neutral to slightly bearish bias. The price recently broke below the cloud after a brief rally, and now the cloud is flat, reflecting indecisiveness in the market. If the price sustains below the cloud, it could signal a continuation of the bearish trend. Conversely, a breakout above 1.10388 would suggest renewed bullish momentum.
Volume analysis reveals mixed activity, with spikes in volume during price rejections at support and resistance zones. The elevated volume during tests of the blue support area indicates buyers are stepping in to defend this level. However, volume has slightly declined as the price approaches the resistance zone, suggesting weaker buying pressure at higher levels.
The Relative Strength Index (RSI) currently sits at 39.74, which is bearish and approaching the oversold territory. This signals potential downside pressure in the short term unless buyers step in to drive the price higher. If the RSI dips further below 40, it would strengthen the bearish outlook, while a recovery above 50 would indicate improving momentum.
In conclusion, AUD/NZD is trading within a critical range, with strong support near 1.09600-1.09800 and resistance around 1.10388. The neutral Ichimoku cloud, declining volume, and weak RSI suggest a lack of strong directional bias. Traders should watch for a decisive breakout above resistance or a breakdown below support for confirmation of the next trend direction. A move below the blue support area could trigger further downside, while a break above 1.10388 may lead to a test of higher resistance levels around 1.10800.
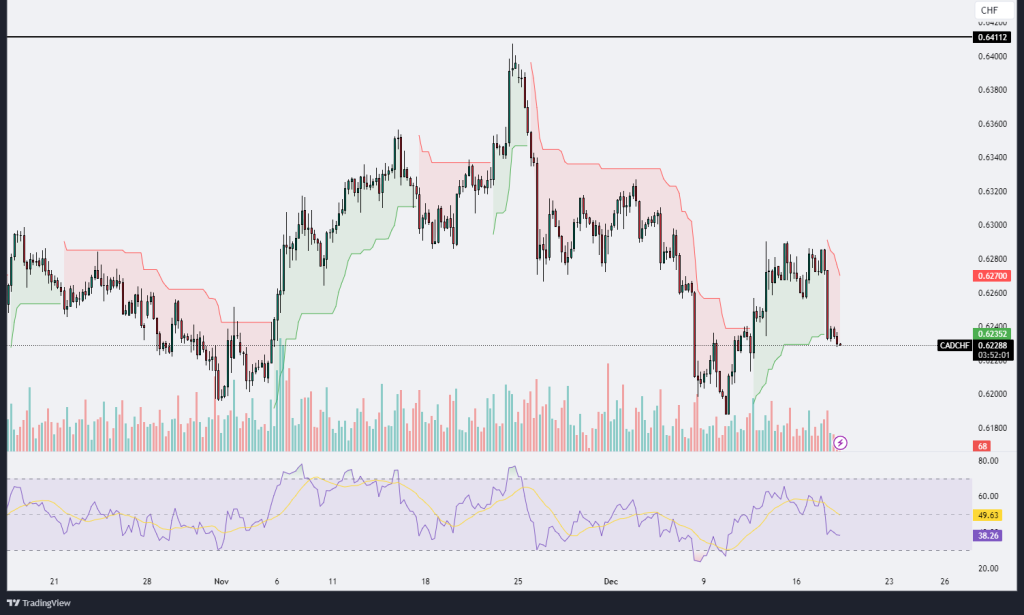
CADCHF
The CAD/CHF chart reflects a bearish sentiment in the short to medium term, with the price currently trading at 0.62288. The market shows a clear downward movement after failing to sustain higher levels around 0.62700. This decline is accompanied by a sharp rejection, as seen by the strong bearish candles, indicating selling pressure at the resistance level. The price has broken below the Ichimoku Cloud, and the cloud itself is turning red, signaling a bearish trend continuation.
The Ichimoku Cloud highlights the shift in momentum. The price briefly entered the green cloud but failed to sustain above it, leading to a downward movement. If the current bearish pressure continues, the next potential support area lies near the 0.62000 level, a key psychological and technical zone that has been tested previously.
The Relative Strength Index (RSI) currently sits at 38.26, nearing oversold conditions. This suggests that while the bearish momentum is strong, the market could soon see a bounce or consolidation if buyers step in near support. However, if the RSI remains below the 40 level for an extended period, it would confirm the continuation of the bearish sentiment.
Volume analysis shows increased activity during the recent drop, indicating strong selling interest. This increase in bearish volume suggests that sellers are firmly in control, at least for now. However, traders should monitor volume near the 0.62000 level to identify potential buying interest.
In summary, CAD/CHF is currently in a bearish trend, trading below the Ichimoku Cloud with increasing volume and weak RSI momentum. The immediate downside target lies near 0.62000, which may act as support. A failure to hold this level could trigger further declines toward lower support zones. On the flip side, a reversal and breakout above the 0.62700 resistance would invalidate the bearish outlook and shift momentum back toward the bulls. Traders should watch for volume activity and RSI behavior near critical support levels for clues about the next market direction.
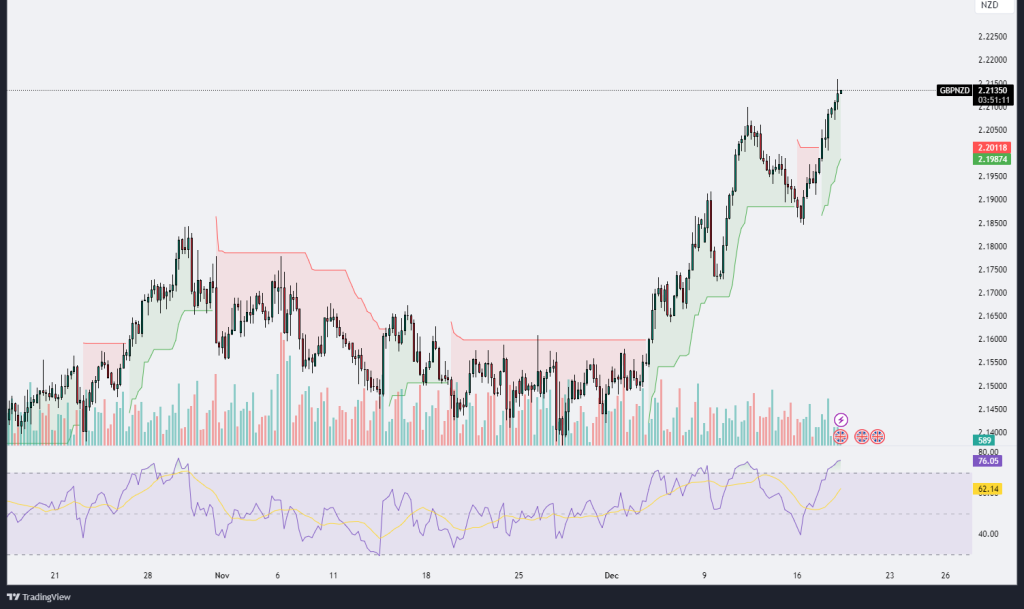
GBPNZD
The GBP/NZD chart displays a strong bullish trend, with the price currently trading at 2.21350, reflecting significant upward momentum. This uptrend is evident in the price action as it consistently moves higher, supported by the Ichimoku Cloud turning green, indicating bullish dominance. The recent surge in price has pushed GBP/NZD to new highs, breaking through previous resistance levels and confirming strong buyer interest.
The Ichimoku Cloud highlights clear upward momentum. The price remains firmly above the cloud, which is acting as dynamic support. The cloud’s upward slope further reinforces the bullish trend, suggesting continued strength as long as the price stays above this zone.
The Relative Strength Index (RSI) is currently at 76.05, which indicates overbought conditions. This level signals that the market may be experiencing short-term exhaustion, and a pullback or consolidation could occur as buyers take profits. However, in strong uptrends, the RSI can remain overbought for extended periods, which means the current bullish momentum may persist before any significant correction.
Volume analysis shows an increase in activity, particularly during the recent surge, suggesting strong participation from buyers. The rising volume confirms the validity of the breakout, as higher volumes during upward movements typically indicate sustained interest and momentum.
From a technical perspective, GBP/NZD has broken through a major resistance level near 2.20000, which could now act as support if a retracement occurs. The next immediate resistance lies near higher psychological levels, potentially around 2.22000 or above. On the downside, support is evident near the cloud base around 2.19000, which aligns with previous consolidation zones.
In summary, GBP/NZD is in a strong uptrend with bullish price action supported by the Ichimoku Cloud and increasing volume. While the RSI indicates overbought conditions, the trend remains intact as long as the price stays above key support levels. Traders should watch for any signs of reversal near overbought territory or prepare for a pullback toward the previous resistance (now support) around 2.20000 before the next leg higher. Continued volume confirmation and a strong cloud structure suggest further potential for upside momentum in the short to medium term.
.png)

.png)


