
Technical Analysis 19.11.2024
AUDCAD
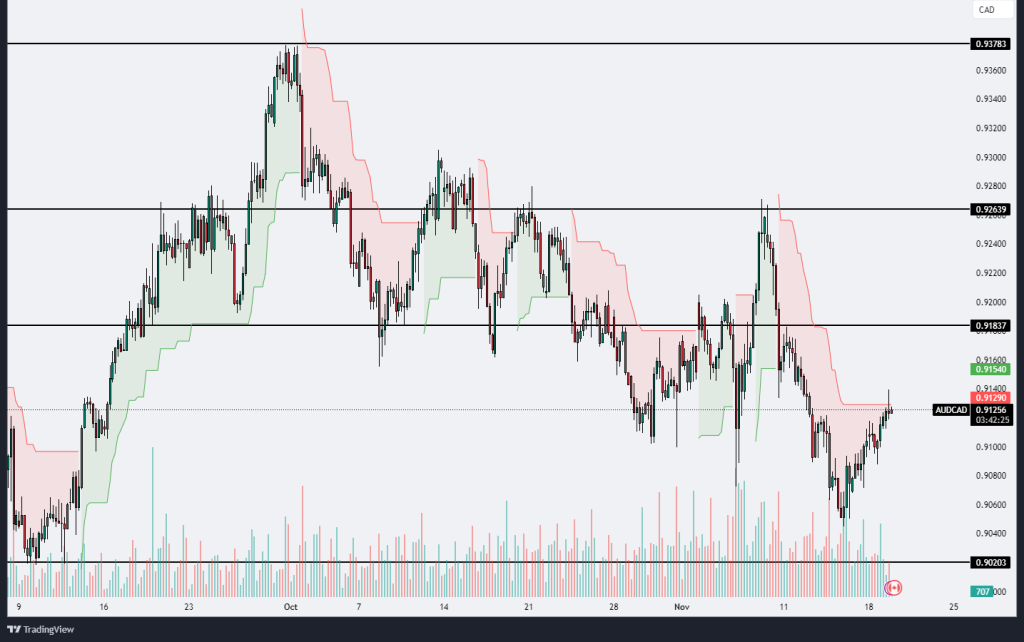
The AUD/CAD chart shows a recent recovery from a low near the 0.90203 support level, as the price has bounced and moved higher. However, it is approaching a critical resistance zone around 0.91540-0.91837, which has previously acted as a strong ceiling for price action. The Ichimoku cloud continues to signal bearish momentum, with the price currently trading below the cloud, although it is attempting to breach this area. A successful close above 0.91837 could indicate the start of a reversal and provide further bullish momentum toward the 0.92639 resistance level.
Volume analysis reveals an increase in activity during the recent upward movement, which suggests growing interest from buyers. However, the overall trend remains bearish, and this recovery may be interpreted as a retracement within the broader downtrend unless the resistance zones are convincingly broken. The RSI indicator is pointing upward but remains below the overbought threshold, suggesting there is room for further upside if momentum continues.
If the price fails to break above the 0.91837 resistance, it may face renewed selling pressure and retrace toward 0.90203, where buyers may re-enter to provide support. Traders should closely monitor the price action around the resistance zone for signs of a breakout or rejection. A sustained move above 0.91837 could shift the bias toward bullish, targeting 0.92639, while a rejection may reinforce the prevailing bearish sentiment.

AUDUSD
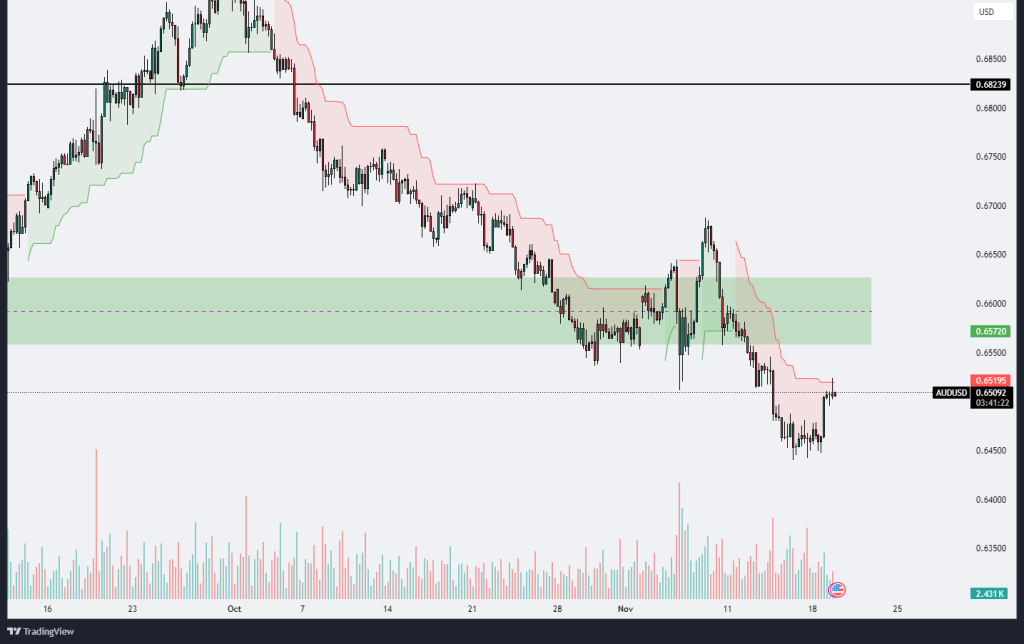
The AUD/USD chart displays a notable bearish trend, with the price having experienced a significant decline from the 0.68239 resistance level. Recently, the pair has shown signs of a potential reversal or consolidation as it attempts to recover from its lows. The price is currently testing the 0.65195 resistance, which aligns closely with the upper boundary of a green supply zone, marking an area of previous support-turned-resistance. This level is a critical juncture; a decisive break above it could pave the way for further upside toward the next resistance at 0.65720. However, failure to break above this zone may result in the continuation of the bearish trend, potentially driving the price back toward recent lows or even lower levels.
Volume analysis reveals a decrease in trading activity during the recent recovery, which suggests caution as the upward momentum might lack strong conviction from market participants. The Ichimoku cloud indicates that the pair remains in bearish territory, with the price trading below the cloud, reinforcing the current bearish sentiment. However, the current attempt to break above the resistance zone and the cloud’s lower boundary may suggest a shift in momentum if buyers can sustain their push.
For traders, monitoring the price action at 0.65195 is crucial. A breakout with strong volume confirmation could indicate a short-term trend reversal, targeting 0.65720 or higher levels. Conversely, a rejection at this resistance could invite renewed selling pressure, driving the pair back toward the support levels in the 0.64500 region. As the market remains in a broader downtrend, any bullish attempts should be treated cautiously unless accompanied by strong breakout signals and volume support.
EURGBP
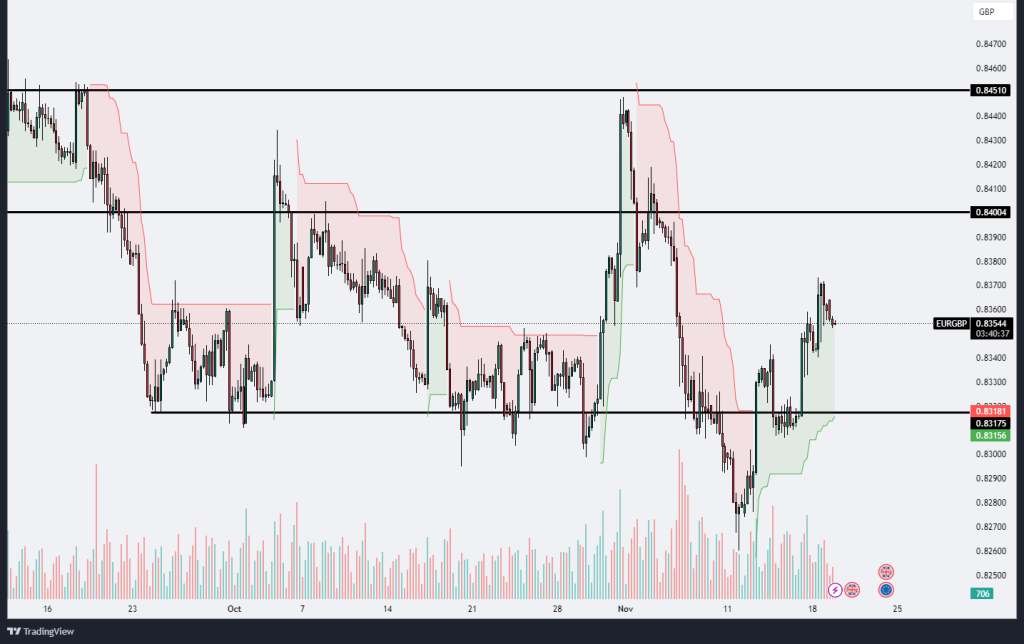
The EUR/GBP chart reflects a recent bullish recovery after testing the key support level at 0.83181, where buyers stepped in to halt the prior bearish momentum. The price currently trades near 0.83544, approaching resistance at 0.84004, which marks a critical level to monitor. If bulls can sustain their momentum and break through this resistance, the next target could be the higher resistance at 0.84510. However, failure to breach 0.84004 could result in consolidation or a potential retracement toward the support zone at 0.83181.
The Ichimoku cloud analysis reveals that the pair is attempting to break out of bearish pressure, with the price trading within or slightly above the cloud. This indicates a shift toward neutrality, with the possibility of transitioning into a bullish trend if a clean breakout is confirmed. However, the trading volume appears to have decreased during the recent upward movement, suggesting that the recovery may lack robust market participation, warranting caution for buyers.
On the RSI indicator, there is a slight bullish divergence as the indicator rises from oversold levels, supporting the recent price recovery. However, it remains below overbought territory, suggesting room for further upside. Traders should closely watch for rejection or breakout signals at 0.84004, as this will determine the short-term direction. A break below 0.83181 would invalidate the bullish outlook, signaling a continuation of the bearish trend, whereas a breakout above 0.84004 would confirm further strength in the recovery.
EURCHF
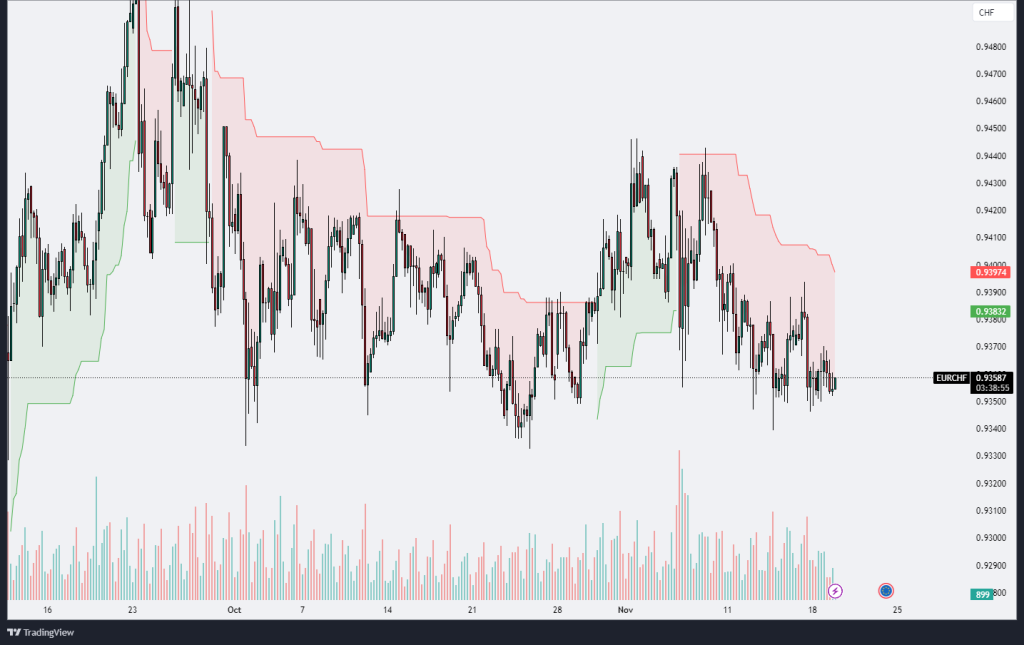
The EUR/CHF chart depicts a prolonged period of consolidation, with the price currently trading at 0.93586, reflecting indecision among market participants. The pair is oscillating within a narrow range, bounded by resistance around 0.93974 and support near 0.93382. This range-bound behavior indicates a lack of directional momentum, as neither bulls nor bears have been able to gain significant control. The presence of the Ichimoku cloud reveals a bearish bias, as the price remains predominantly below the cloud, though the cloud’s thin structure suggests weak trend strength.
Volume analysis shows relatively low participation, aligning with the lack of clear movement, which could be indicative of market hesitation or a wait-and-see approach ahead of potential catalysts. The RSI hovers near neutral levels, neither oversold nor overbought, further confirming the absence of strong momentum. However, the RSI is slightly tilted downward, hinting at a mild bearish preference.
For traders, a breakout above 0.93974 could signal bullish intent, potentially targeting higher resistance levels near 0.94500. Conversely, a decisive breakdown below 0.93382 might pave the way for further downside, with the next key support level around 0.93000. Until a breakout occurs, the pair is likely to remain in consolidation, making range-bound strategies like buying at support and selling at resistance more favorable. Monitoring for increased volume at critical levels will be crucial to confirm any potential breakout or breakdown.
.png)

.png)


