

Forex Market Update: USD/JPY Faces Key Support, NZD/CAD Breaks Higher, GBP/AUD Stalls
USDJPY
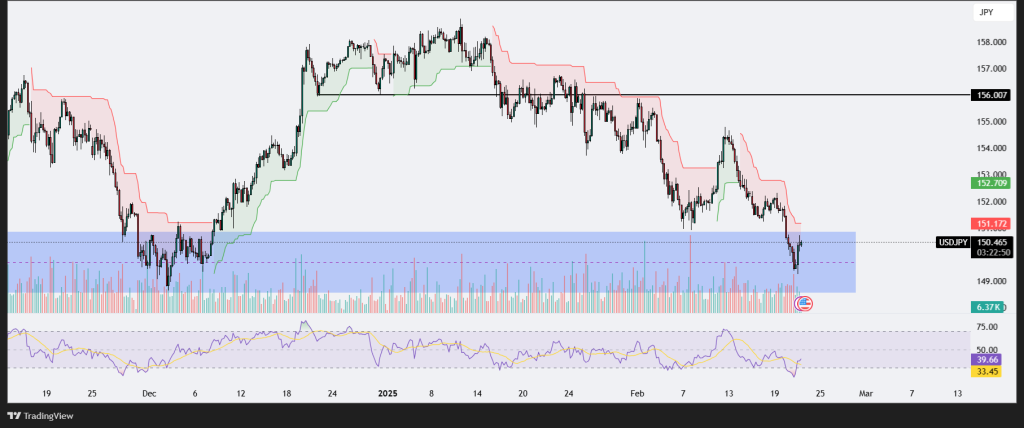
The USDJPY chart presents a clear downtrend, with the price currently trading at 150.465 after a recent bounce from a significant demand zone (highlighted in blue). This support area, roughly between 149.000 and 150.000, has acted as a critical zone where buyers have historically stepped in to defend the price, preventing further downside moves. However, despite this bounce, the overall market structure remains bearish, as indicated by the Supertrend indicator, which remains in a downtrend mode with red shading over the candles.
The price previously broke below the key 152.700 – 153.000 support-turned-resistance area, leading to an accelerated decline toward the current support zone. The breakdown was accompanied by increased volume, suggesting strong selling momentum. However, as price reached the 150.000 psychological level, buyers started absorbing the selling pressure, leading to the current rebound.
The Relative Strength Index (RSI) is currently at 33.45, signaling oversold conditions. This suggests that the recent selling pressure may have been overextended, leading to a potential short-term relief rally. A sustained push above 40 on the RSI could indicate a shift in momentum favoring the bulls. However, failure to reclaim 50+ levels would suggest that this is merely a relief rally within a larger downtrend.
For bullish confirmation, USDJPY needs to break and hold above 151.200 – 151.500, where selling pressure may re-emerge. If buyers fail to reclaim these levels, the downtrend could continue, with the next key support at 149.000 and possibly lower. On the flip side, if the pair successfully reclaims 152.000, it could challenge the previous major resistance at 156.000, which remains a longer-term upside target.
Volume analysis shows lower participation on this bounce compared to the previous down-move, suggesting that the recovery lacks strong buying conviction. If volume increases as price moves higher, it would add confidence to a potential reversal.
GBPAUD
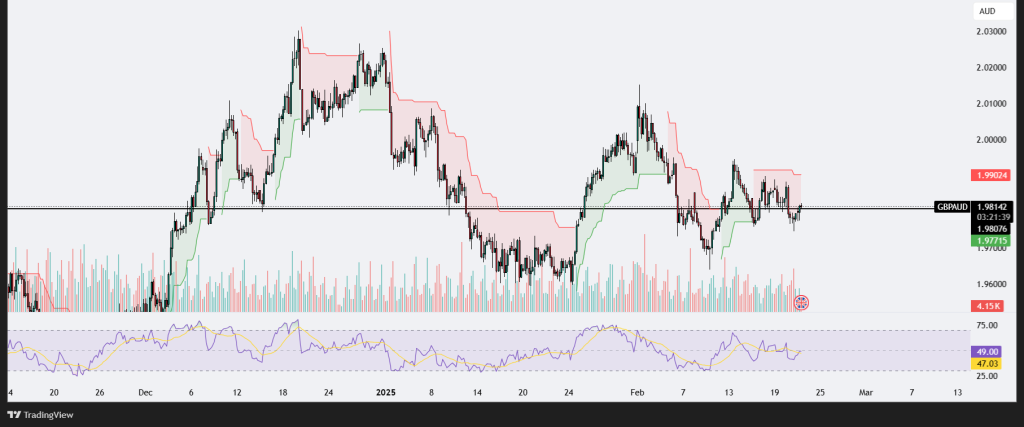
The GBPAUD chart presents a range-bound price action, currently trading at 1.98142, testing a key support-turned-resistance level around 1.9800. The price has been fluctuating within a defined range, with lower highs and higher lows, suggesting a consolidation phase where neither bulls nor bears have clear dominance.
The Supertrend indicator shows mixed signals, with the red shading above price action indicating bearish momentum in the short term, while the green support areas suggest intermittent buying pressure. The previous support at 1.9800, which held for multiple touches, is now acting as resistance, making this a pivotal area to watch for either a breakout or a rejection.
From a momentum perspective, the Relative Strength Index (RSI) is at 47.03, indicating neutral momentum. It is neither in the oversold nor overbought region, suggesting that price direction remains uncertain until a clearer move occurs. If the RSI breaks above 50, it could signal a potential bullish shift, while a drop below 40 could confirm further downside pressure.
EURCAD
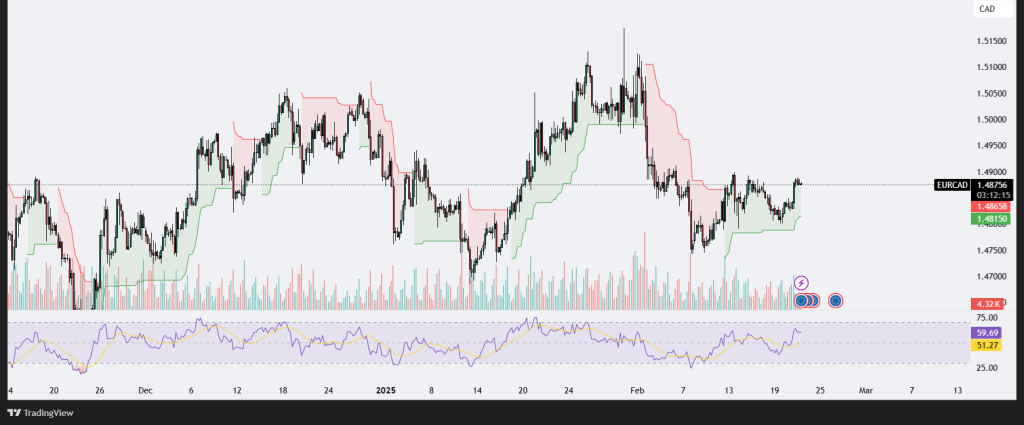
The EURCAD chart is displaying a moderate bullish recovery, currently trading around 1.48755. The price has been in a consolidation phase, forming a series of higher lows, suggesting a potential attempt at breaking resistance. The Supertrend indicator is turning green, indicating a shift in sentiment from bearish to bullish.
From a price structure perspective, the pair previously faced a downtrend but has recently bounced off key support levels, regaining momentum. The volume remains relatively low, meaning that the current upward move might need stronger buying interest to confirm a sustained breakout.
The Relative Strength Index (RSI) is at 59.65, nearing the overbought zone but still within the bullish range. If the RSI crosses above 60-65, it could signal further upward potential, while a rejection around this level might indicate a temporary pullback.
EURCAD is showing bullish momentum, but it needs a clear breakout above resistance to confirm a trend continuation. If price consolidates and holds above 1.4850, the bullish move could gain strength. However, failure to break resistance might lead to range-bound movement or a retest of lower support zones. Traders should monitor volume, RSI trends, and price action near 1.4900 for the next significant move.
NZDCAD
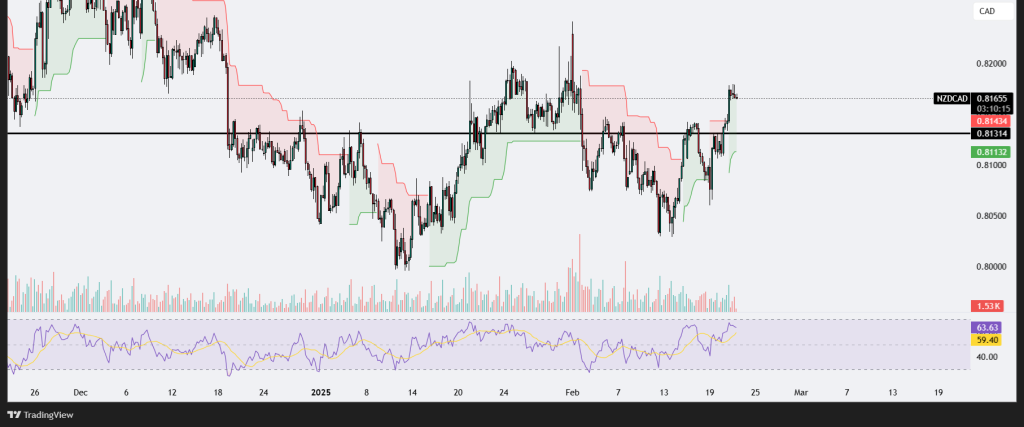
The NZDCAD chart shows a strong bullish breakout, currently trading around 0.81654. The price has successfully broken through the key resistance level at 0.81314, which previously acted as a strong resistance zone. The Supertrend indicator is turning green, suggesting a continuation of bullish momentum.
From a technical perspective, this breakout could lead to further upside movement if the price sustains above the 0.8130 – 0.8140 range. The RSI (Relative Strength Index) is at 63.58, approaching overbought territory but still in a bullish range. If the RSI continues to rise above 65-70, it could indicate a continuation of the upward move. However, if the RSI starts to decline, it may signal a short-term retracement before another potential leg higher.
NZDCAD is currently in a bullish structure, and the breakout above the previous resistance zone suggests potential for further gains. However, traders should watch for price action confirmation around the 0.8130 – 0.8150 zone to ensure the breakout holds. If buyers maintain control and volume increases, the next upside target could be 0.8200 or higher. Conversely, a drop below 0.8130 could indicate a false breakout and lead to a retest of lower support levels.
.png)

.png)


