

Silver and Gold Continue Bullish Rallies, USDNOK and USDCNH Face Downward Bias
XAGUSD
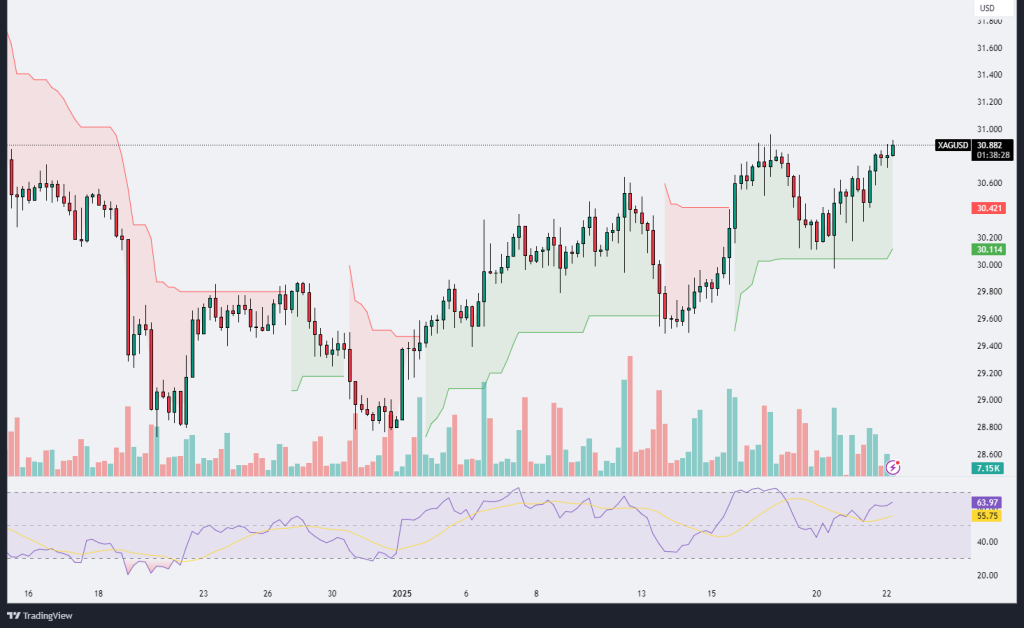
The XAG/USD (Silver) chart shows a steady uptrend, with the price currently trading around $30.887, approaching a key psychological resistance level at $31. The Ichimoku cloud indicates bullish momentum as the price remains above the cloud, reinforcing the current upward bias. Recent price action shows a series of higher lows and higher highs, a classic sign of a strong uptrend. The volume profile, while not significantly spiking, supports the steady rise, suggesting consistent buyer interest rather than erratic market participation.
The RSI currently sits at 64.10, nearing the overbought threshold of 70, indicating strong bullish momentum but also cautioning that the rally may face resistance if the momentum weakens. A breakout above $31 would confirm further bullish continuation, potentially targeting higher levels around $31.50 or beyond. On the other hand, a failure to break and sustain above $31 could lead to a pullback, with immediate support levels around $30.40 and $30.11, where the Ichimoku cloud’s lower boundary aligns.
Traders should watch for confirmation of a breakout on increased volume for further bullish momentum or a reversal pattern if the price faces significant resistance. RSI behavior will also be critical to monitor, as any bearish divergence could signal a potential trend reversal or consolidation phase.
USDCNH
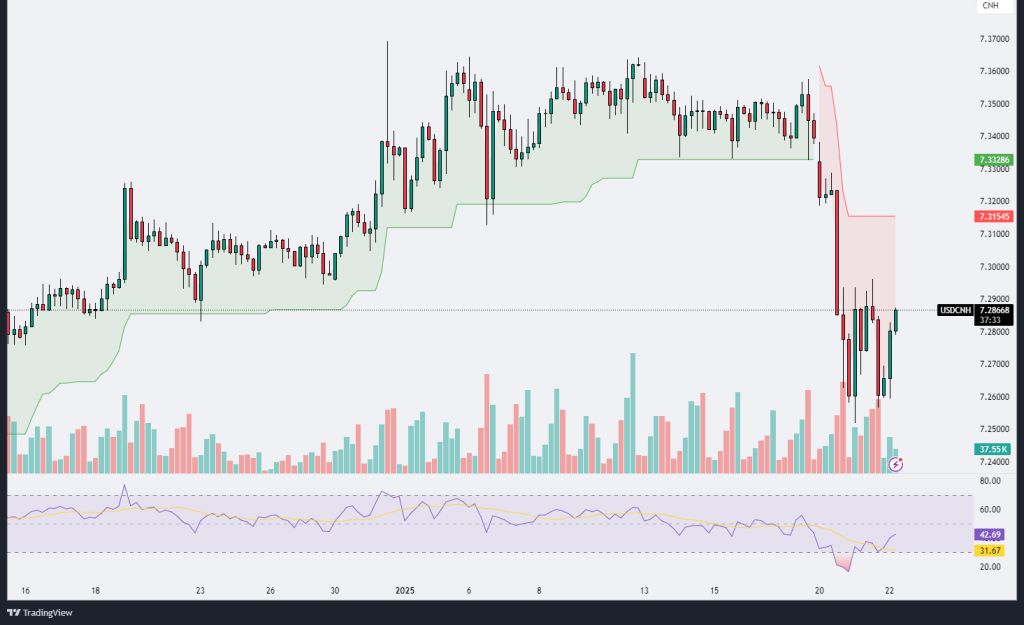
The USD/CNH chart reveals a recent sharp downward movement, with the pair currently trading near the 7.2866 level after attempting to recover from a significant drop. The price is testing the lower boundary of the Ichimoku cloud, which is serving as a dynamic resistance zone around 7.3135. This suggests that bearish momentum remains dominant, and any recovery attempt may face resistance in this area. The recent increase in volume accompanying the downward move indicates strong selling pressure, further emphasizing the bearish outlook.
The RSI currently reads 42.69, showing slight recovery from oversold conditions but still leaning toward bearish territory. This suggests that while some short-term buyers have stepped in, the overall momentum remains weak. Should the price break above the cloud resistance, it could lead to a further recovery toward the 7.33–7.35 range. However, a failure to breach the resistance could lead to continued downward pressure, with key support levels around 7.2700 and 7.2500.
Overall, the pair’s technical setup indicates that bearish sentiment dominates, with any upside likely to face significant resistance. Traders should monitor volume and RSI behavior closely for signs of either a deeper correction or a possible reversal above the cloud resistance zone.
USDNOK
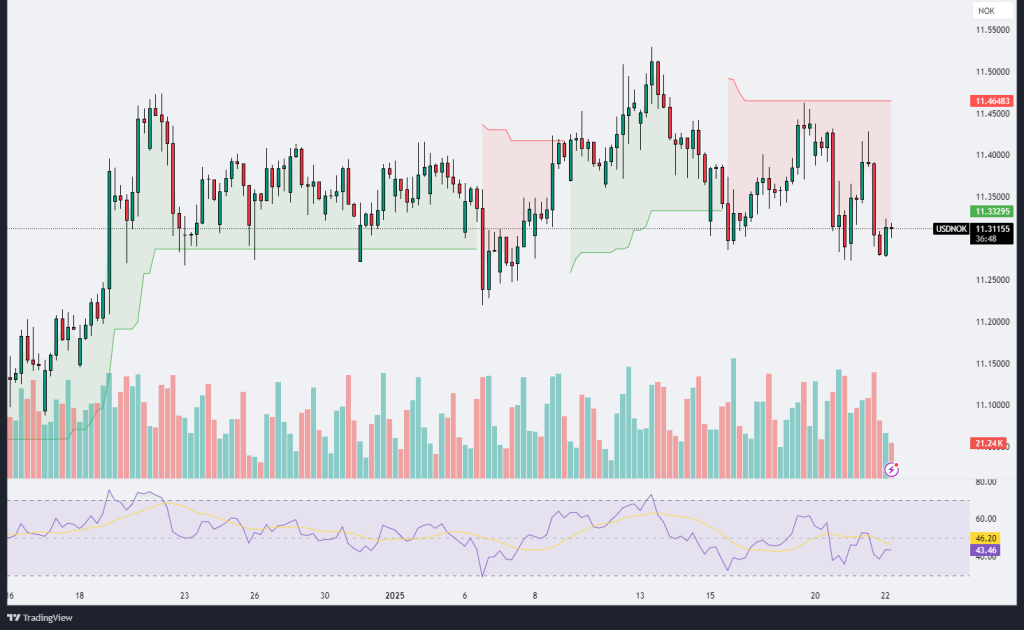
The USD/NOK chart demonstrates a volatile trading environment, with the pair currently positioned near the 11.33295 level, indicating a slight bearish sentiment in the market. The price action has fluctuated around the Ichimoku cloud, with the current position slightly below the cloud, suggesting bearish pressure. The cloud’s red zone above indicates a resistance range around 11.4500, which could act as a significant barrier for upward movement in the near term. The recent increase in selling volume further reinforces the downward bias, highlighting stronger participation from sellers.
The RSI, positioned at 43.46, reflects a bearish momentum but is not in oversold territory, implying that there is still room for further downside. This level of RSI shows that the bears are in control but with cautious participation. The recent price movements suggest a consolidation phase, with the pair testing lower support levels near 11.3000 while facing resistance at 11.4600. If the price breaks below the 11.3000 support, it could accelerate downward toward 11.2500, which aligns with the next significant support zone.
In summary, the USD/NOK pair exhibits a bearish bias, with downward pressure supported by selling volume and RSI levels. A break below the current support could invite more sellers, while a rebound above the Ichimoku cloud might shift the sentiment to neutral or bullish. Traders should closely monitor volume trends and momentum indicators for any potential breakout or reversal signals.
XAUUSD
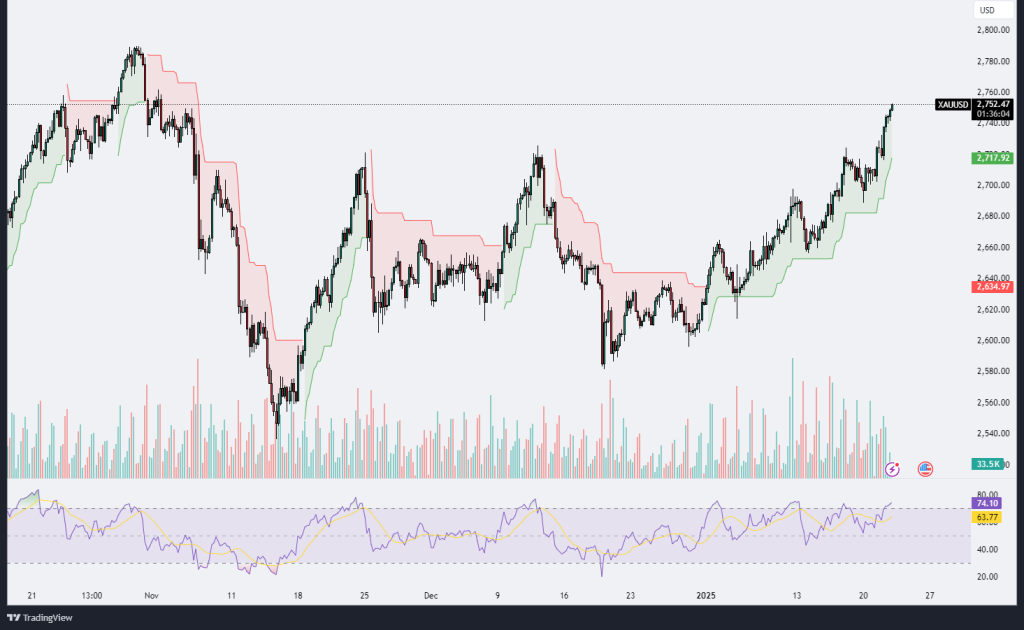
The XAU/USD chart indicates a clear uptrend, with gold prices reaching $2,752.46 as of the latest data. The price action is consistently trading above the Ichimoku cloud, which provides a strong bullish signal. The green Ichimoku cloud below the current price level reinforces the upward momentum and suggests strong support zones in the $2,700 to $2,640 range. The recent breakout above previous resistance levels near $2,717 signifies increased bullish strength, and the lack of significant pullbacks further highlights the strong buying pressure in the market.
The RSI is currently at 74.10, indicating overbought conditions. While this might suggest a potential short-term pullback, the strong momentum reflected in both the RSI and volume activity supports the possibility of continued bullish momentum. The increased trading volume accompanying the price rise validates the strength of the current uptrend, as buyers remain firmly in control. However, traders should monitor closely for signs of exhaustion, as the overbought RSI levels could lead to profit-taking or temporary consolidation around these levels.
In summary, XAU/USD is in a strong bullish phase, supported by technical indicators like the Ichimoku cloud, RSI, and volume trends. As the price approaches psychological resistance near $2,760, traders should watch for potential profit-taking or consolidation. A sustained breakout above this level could open the door for further upside, while any retracement would likely find support within the $2,700 to $2,640 range.
.png)

.png)


