

NZDJPY Bullish Momentum Builds, GBPNOK Continues Bearish Trend, USDSGD Eyes Reversal
NZDJPY
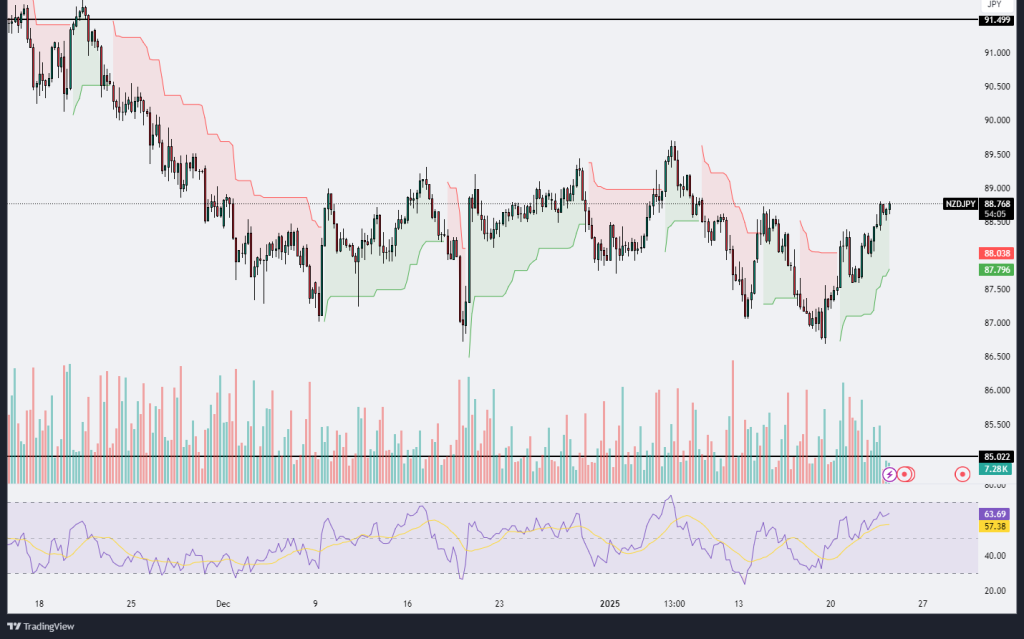
The NZD/JPY chart illustrates a recent bullish momentum as the pair approaches the 88.768 level, with strong recovery from previous lows near 85.022. The Ichimoku cloud on the chart suggests that the price is trading above the green cloud, indicating a bullish sentiment in the short term. This movement demonstrates a shift from a prior period of consolidation and downward pressure. The proximity of the price to key resistance at 89.000 suggests that buyers are pushing to retest higher levels, but a significant breakout above this point will be necessary to confirm continued upward momentum.
The RSI is currently around 63.69, signaling that the market is in a bullish but not overbought territory, which leaves room for additional upward movement. The volume analysis shows a gradual increase, which validates the buying strength and supports the possibility of an extended rally. However, any failure to break above the 89.000 level might result in a pullback towards the support region near 87.796, where previous resistance turned support could act as a stabilizing factor.
In summary, NZD/JPY is exhibiting strong bullish momentum, with traders likely watching for a breakout above 89.000 for confirmation of further upside potential. If the resistance is rejected, the pair could consolidate or retrace to test lower support zones, making it a critical juncture for both bulls and bears.
GBPNOK
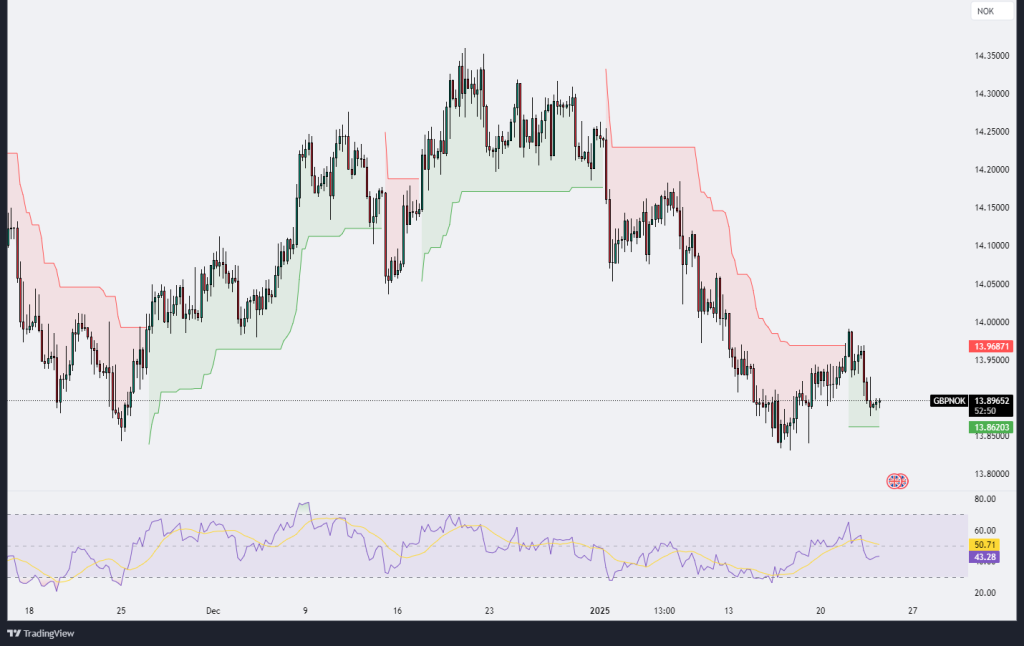
The GBP/NOK chart indicates a continuation of the recent bearish trend, with the price currently trading around the 13.89 level, having retraced from recent highs near 14.25. The price is below the Ichimoku cloud, signaling sustained bearish momentum and highlighting the dominance of sellers in the market. Additionally, the rejection from the resistance level at 13.97 suggests that the pair is struggling to gain upward traction, reinforcing the bearish sentiment.
The RSI is currently at 43.29, indicating that the market is neither oversold nor overbought, but it is leaning towards bearish conditions. This implies the potential for further downside movement if selling pressure persists. However, a bounce from the recent support level around 13.86 could create a short-term pullback, particularly if buyers step in to defend this zone.
Volume analysis shows a decline in activity during the recent price movements, indicating that sellers may be losing momentum. However, unless there is a clear breakout above the resistance levels or significant bullish volume, the bearish trend is likely to persist. Overall, GBP/NOK remains in a downtrend, with critical support around 13.86 being closely monitored by traders for potential reversals or further bearish continuation.
USDSGD
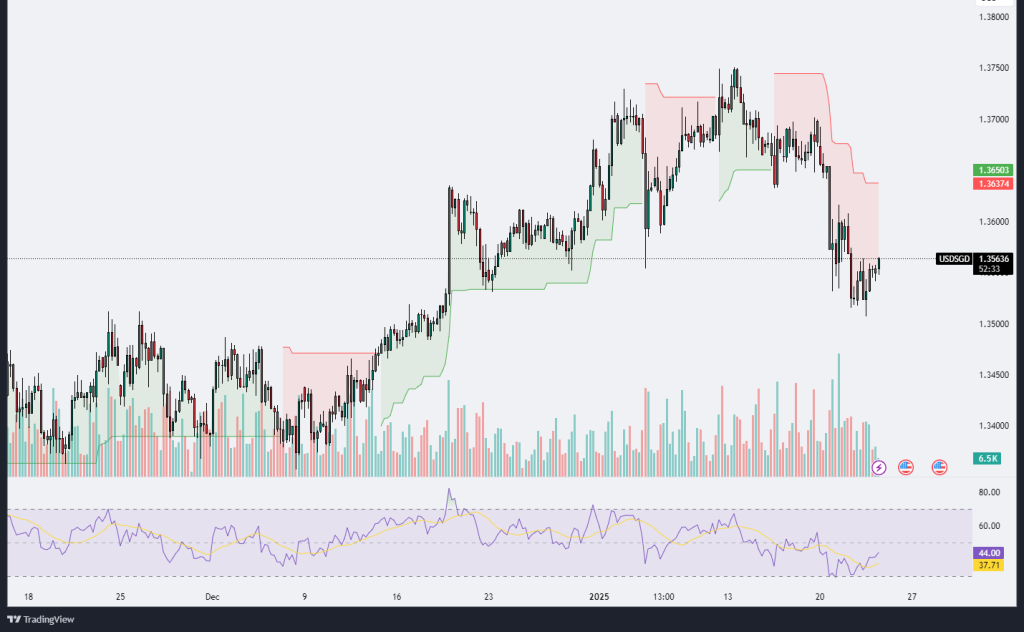
The USD/SGD chart shows a recent bearish trend, followed by signs of potential consolidation or a reversal attempt. The price has fallen sharply from its recent high near 1.3700 and is currently trading around 1.3560. The red supertrend indicator confirms the prevailing bearish sentiment, but the candlesticks suggest that the sell-off may be stabilizing as buyers attempt to defend the lower levels. The RSI is in the oversold territory, currently reading around 43.98, which might indicate a weakening momentum in the downtrend and a possible bounce in the near term. Volume activity shows a significant spike during the recent drop, which may signal strong selling pressure, although the decreasing volume in recent candles implies waning selling interest. Overall, the pair is at a critical juncture, where it may either extend its decline if it fails to attract sufficient buying interest or rebound if buyers can reclaim control and push prices higher. Traders should watch key resistance around 1.3637 for confirmation of a recovery and support near the recent low for signs of further weakness.
USDCAD
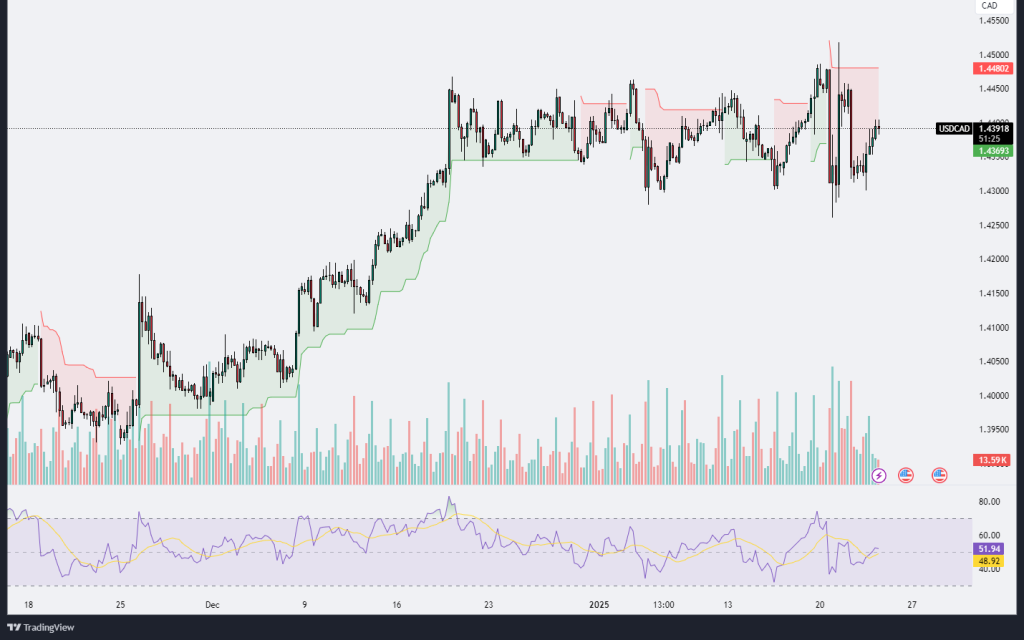
The USD/CAD chart indicates a period of heightened volatility, with price action recently experiencing a sharp spike followed by a retracement. The pair is currently trading near 1.4390 after recovering from a dip below 1.4350. The supertrend indicator suggests a mixed sentiment as the price fluctuates between bullish and bearish zones. Notably, the price recently attempted to break through the resistance near 1.4480 but was rejected, indicating that sellers are actively defending higher levels. The RSI is hovering near the 52 level, reflecting a neutral momentum with a slight bullish bias. Volume analysis reveals a spike during the recent upward move, which suggests strong buying interest; however, the decreasing volume in the retracement phase implies weakening seller conviction. Overall, the pair is consolidating after its recent volatility, and traders should monitor key levels such as the support at 1.4360 and resistance at 1.4480 for further directional cues. A decisive break above 1.4480 could open the path toward higher levels, while failure to hold above 1.4360 might trigger another downward move.
.png)

.png)


