

Technical Analysis 23.10.2024
USDCAD
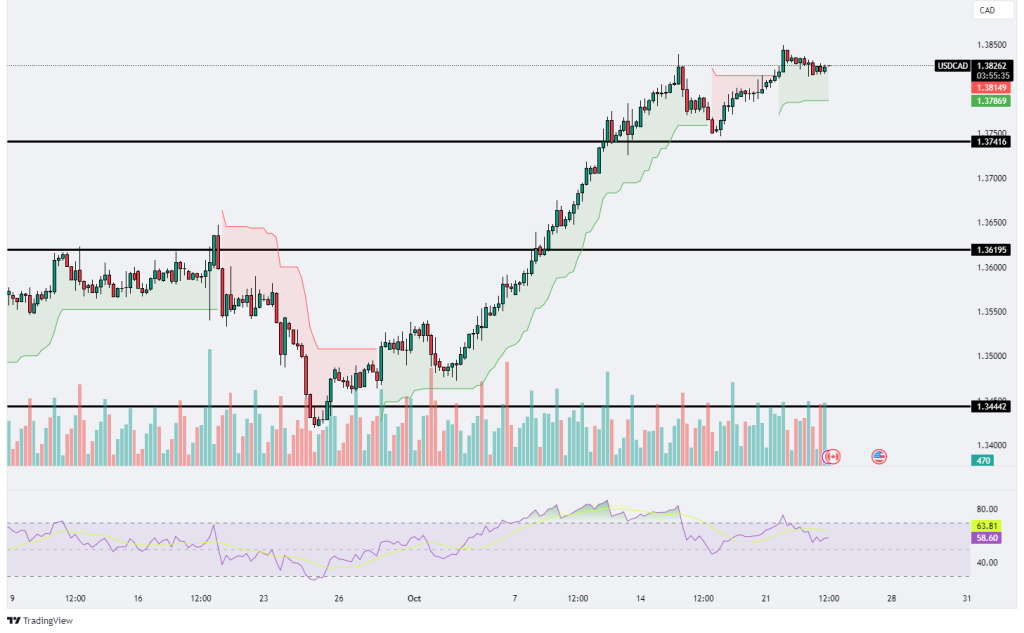
The USD/CAD chart is currently trading around 1.38262, showcasing a strong and steady upward trend that has been in place since late September. After a period of consolidation at lower levels near 1.34442, the pair began a significant rally throughout October, pushing higher and consistently forming higher highs and higher lows. The price is now approaching a key resistance level near 1.38500, where it has stalled slightly but remains well-supported by the ongoing bullish momentum. The Ichimoku Cloud offers clear confirmation of the strong bullish trend, with the price comfortably trading above the cloud, which provides dynamic support. This suggests that the upward trajectory remains intact, and as long as the price continues to hold above the cloud, the bullish outlook is expected to persist. A break above the 1.38500 resistance level could open the door for further gains, potentially targeting higher psychological levels as buyers continue to dominate the market.
However, the RSI currently stands at 63.81, reflecting a bullish condition, but it is showing signs of flattening, indicating that the upward momentum may be losing steam in the short term. Although the RSI is not yet in overbought territory, the slight decline could be an early warning that the market may experience a period of consolidation or even a minor correction before attempting another push higher. Should the price fail to break above 1.38500, the key support levels to watch include 1.37416, which acted as previous resistance and could now provide a solid floor for a potential rebound. Further down, 1.36195 is another significant support area where the price consolidated before its recent surge, and a pullback to this level could attract fresh buying interest.
Volume has been relatively steady throughout this rally, with no significant spikes indicating an imbalance in buying or selling pressure. This suggests that while the market is trending higher, traders may be adopting a more cautious approach, waiting for clearer signals before committing to larger positions. The steady volume also implies that there is no excessive buying pressure at the moment, which could either mean that the uptrend continues in a more controlled manner or that the market is waiting for a catalyst to drive the next big move.
Overall, the outlook for USD/CAD remains bullish, but traders should be mindful of the potential for consolidation or a correction as the price approaches the 1.38500 resistance level. If the price breaks above this key resistance, further gains could be realized, potentially targeting the next psychological levels higher. However, a failure to clear this hurdle could result in a pullback, with 1.37416 and 1.36195 acting as critical support zones. For now, the market remains cautiously optimistic, with strong technical indicators supporting the ongoing uptrend, but attention should be paid to any signs of weakening momentum.
USDJPY
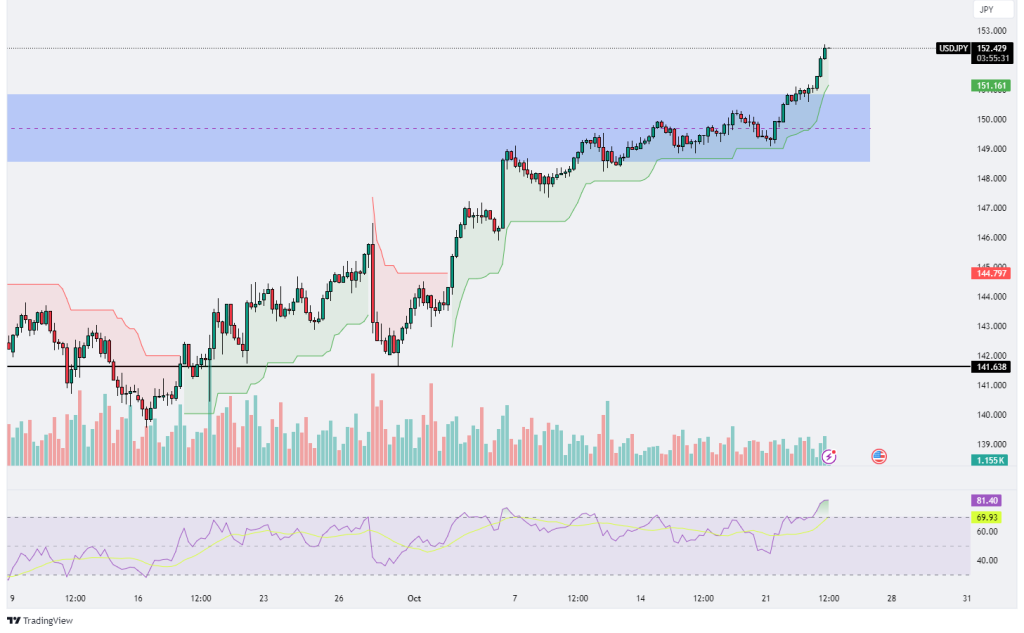
The USD/JPY chart is currently trading around 152.439, displaying strong bullish momentum as the price has recently broken out of a key resistance zone around 151.165, propelling it to fresh multi-month highs. The pair had been consolidating between 149.000 and 151.165 before this breakout, and the move above the resistance indicates robust buying pressure and strong upward momentum. This breakout has shifted the 151.165 level into immediate support, which is now a key area to watch for any potential pullback. Should the price retrace, this level is likely to act as a strong foundation for further buying interest. There is currently no clear resistance directly above, given that the market is trading at new highs, but psychological levels like 153.000 could become the next targets for bulls if the upward trend continues.
The Ichimoku Cloud further reinforces the bullish sentiment, with the price trading well above the cloud, which is wide and green, signaling strong momentum in favor of buyers. The cloud acts as dynamic support, suggesting that as long as the price remains above it, the bullish trend will likely persist. However, the RSI is currently at 81.61, indicating that the market has entered overbought territory. While the overbought RSI confirms the strength of the rally, it also suggests that a potential pullback or consolidation could be on the horizon as the market cools off from these extended levels. The sharp rise in the RSI highlights the intensity of the current bullish move, but caution is advised, as markets typically do not stay overbought for prolonged periods.
The volume during the breakout has also increased, confirming strong buying interest and suggesting that this upward move is backed by solid market participation. This volume spike adds confidence to the breakout, signaling that the bulls have firm control over the market. Overall, the outlook for USD/JPY remains bullish, with potential upside targets at higher psychological levels, but traders should be aware of the risks associated with the current overbought conditions. A short-term correction or consolidation could offer buying opportunities near 151.165, while further upside could lead to new highs if the bullish momentum continues.
GBPAUD
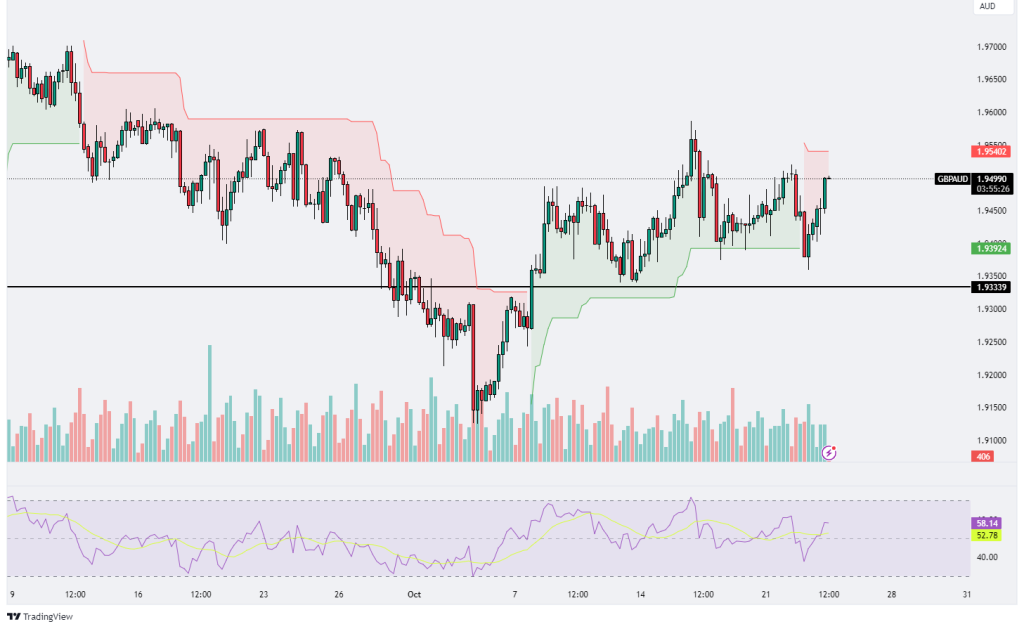
The GBP/AUD chart is currently trading around 1.94991, exhibiting a period of consolidation between the strong support at 1.93339 and the key resistance at 1.95402. After experiencing a decline to the lower boundary of this range, the price found support around 1.93339 and has since bounced back, showing signs of recovery as it approaches the 1.95402 resistance level. This resistance zone has proven difficult to break through in the past, and the price is now testing this level once again. The price action over the past few weeks has been volatile, with sharp movements both downward and upward, reflecting a market grappling with uncertainty but displaying a slight bullish bias in the recent rebound. The Ichimoku Cloud presents a neutral to slightly bullish signal, with the price just above the cloud, but the cloud itself is thin, which indicates that momentum behind the current trend is relatively weak. The cloud could act as dynamic support, and if the price remains above it, this may reinforce the idea of a bullish move, though traders should be cautious as momentum may not be strong enough for a sustained breakout just yet.
Additionally, the RSI currently stands at 58.16, indicating a slightly bullish condition with room for more upside movement. The RSI is not overbought, which suggests that the market has the capacity to push higher if buyers maintain control. However, the recent volatility, along with the RSI’s position just below the 60-mark, indicates that the market is in a delicate balance, with a potential for further gains but also the risk of retracement should the resistance level hold firm. Volume, on the other hand, has remained moderate, which suggests that the market is in a “wait-and-see” mode, with traders likely awaiting a clearer breakout above the 1.95402 level or a confirmed rejection before committing to larger positions. A sustained breakout above this resistance would likely signal further bullish momentum, potentially pushing the price higher toward new levels, while a failure to break above could lead to a retest of the 1.93339 support. Overall, the market remains cautiously optimistic with a slight bullish bias, but traders should be mindful of the thin Ichimoku Cloud and moderate volume, both of which signal that the market may be waiting for a stronger catalyst to make a decisive move.
GBPCAD
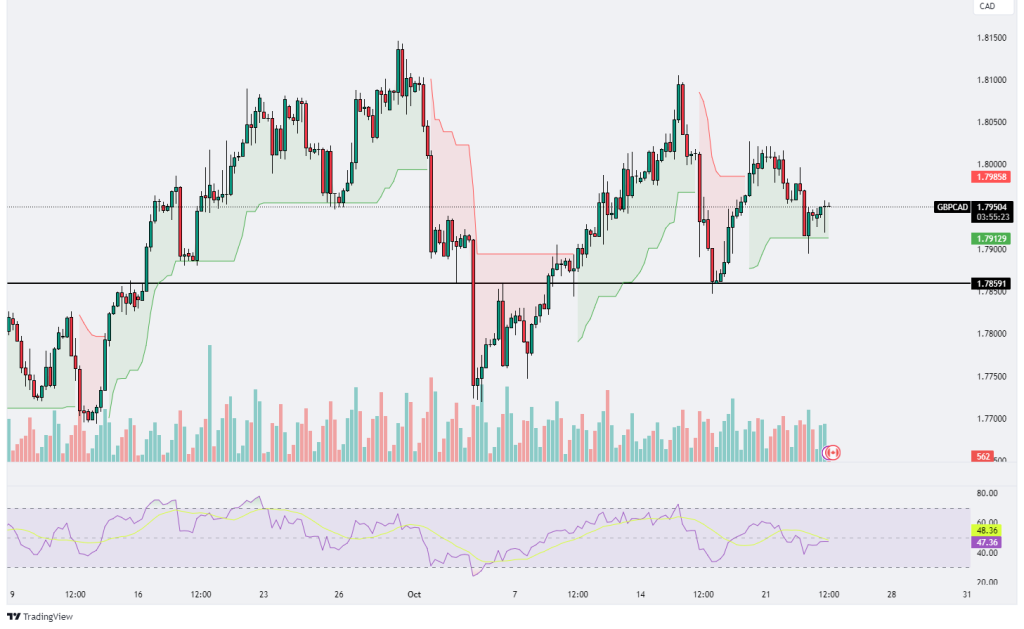
The GBP/CAD chart is currently trading around 1.79446, reflecting a consolidation phase following a period of volatility, particularly after a pullback from the recent highs near 1.80500. The price has found support around the 1.78591 level, which has been tested several times and has held firm, indicating that this is a significant level for traders to watch. The recent decline from the highs above 1.8000 has led the pair to hover just above this support, with the price currently facing resistance around 1.79858. A break above this resistance could signal a return to bullish momentum, possibly leading to a retest of the 1.80500 highs or even further upside. However, the consolidation phase indicates that traders are uncertain about the next directional move, as the price action remains somewhat muted.
The Ichimoku Cloud shows a neutral outlook, with the price fluctuating in and out of the cloud, suggesting that the market lacks clear momentum in either direction. The cloud itself is thin, further reinforcing that the current trend is weak and that the market could break either way depending on future developments. The neutral stance of the Ichimoku Cloud aligns with the overall consolidation seen in the price action, as both bulls and bears appear to be waiting for a clearer signal before committing to any major moves. The thin cloud suggests that a decisive breakout or breakdown could change the market’s bias, but for now, the trend remains uncertain.
Volume has been relatively moderate throughout this consolidation phase, indicating that there is no strong buying or selling pressure at the moment. Traders are likely waiting for a breakout above 1.79858 or a breakdown below 1.78591 to take clearer positions. If the support at 1.78591 breaks, the market could see a deeper correction to lower levels, while a break above 1.79858 could pave the way for a resumption of the recent bullish trend. Overall, the market is in a wait-and-see mode, with traders looking for more directional clarity before committing to larger positions. The neutral outlook from the Ichimoku Cloud, coupled with moderate volume, suggests that the next few sessions will be crucial in determining whether the price will break higher or lower from this consolidation phase.
.png)

.png)


