
Technical Analysis 25.10.2024
GBPJPY
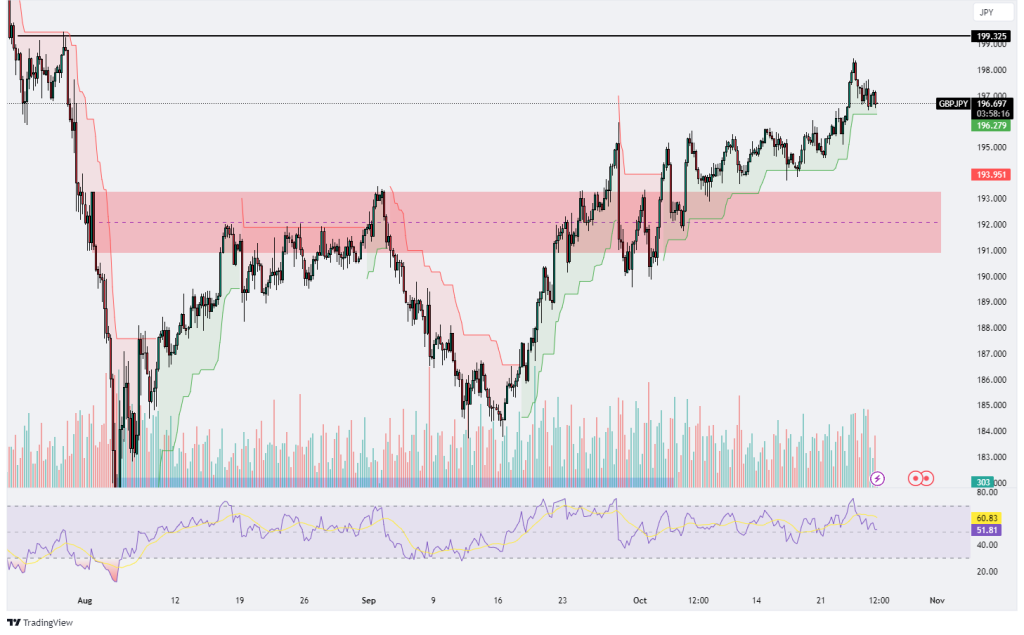
The GBP/JPY chart presents a clear bullish trend, with the price steadily climbing after a previous downturn, now approaching a significant resistance level around 199.325. This resistance level has proven to be a key hurdle, and any break above this could signal a continuation of the bullish momentum, potentially pushing the pair toward new highs. On the downside, there is a strong support zone around 193.951, which is highlighted by the red shaded area and has historically served as both a support and resistance level. If the price pulls back, this zone could act as a solid area for buyers to re-enter the market. The Ichimoku cloud further supports the bullish outlook, as the price is trading well above the cloud, indicating strong upward momentum. The cloud is green and upward sloping, reinforcing the strength of the current trend. Past pullbacks have found support at the cloud, further suggesting that bullish sentiment remains dominant as long as the price holds above this area. In terms of volume, there have been noticeable spikes during key price movements, signaling active participation from market players at pivotal moments, but volume has since stabilized, reflecting a period of consolidation before a potential breakout or retracement. The Relative Strength Index (RSI) is hovering around 60.83, which is within bullish territory but approaching overbought levels, suggesting that the upward momentum may be nearing a point of exhaustion if it continues unchecked. While the RSI isn’t yet at overbought levels, it warrants caution as the price approaches the resistance zone. Overall, the GBP/JPY pair is in a well-defined uptrend, but the critical resistance at 199.325 remains a key level to watch. A breakout above this resistance could confirm further upside potential, whereas a rejection could lead to a pullback towards the support zone or the Ichimoku cloud. Despite the potential for a short-term correction, the overall trend remains bullish as long as the price stays above the cloud and key support levels, making the pair a strong candidate for continued upward momentum in the near term.

USDDJPY
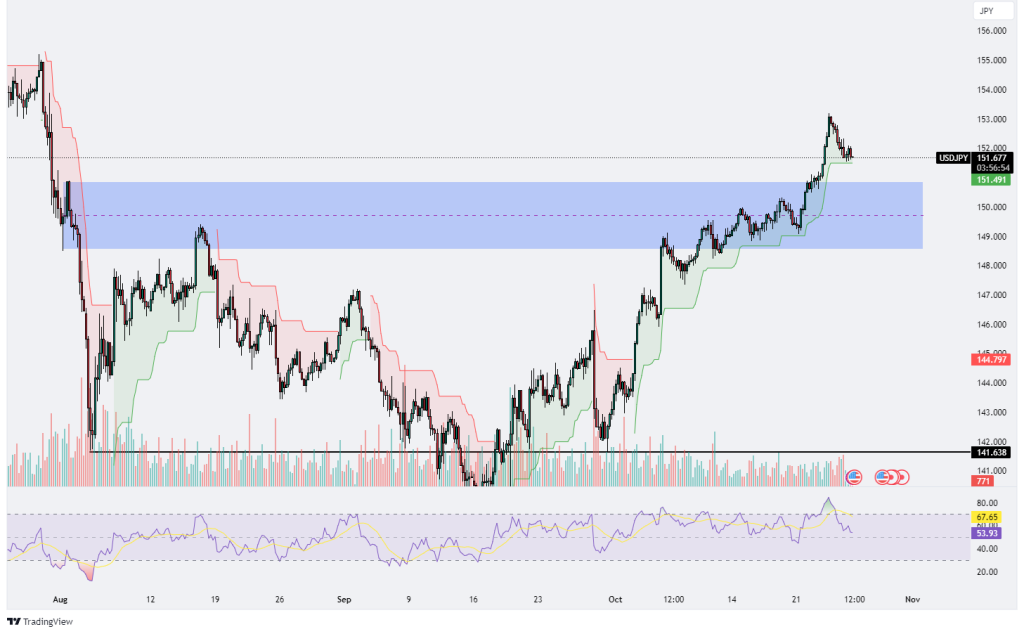
The USD/JPY chart showcases a strong and well-established bullish trend, with the price consistently climbing and recently encountering a slight pullback after approaching the resistance level around 152.000. The bullish momentum is clearly supported by the Ichimoku cloud, with the price trading well above it, signaling ongoing upward strength. The cloud itself remains green and sloping upward, further confirming the bullish sentiment and offering a strong support zone should the price experience any further corrections. The area around 151.491, previously acting as resistance, has now turned into a support zone, highlighted by the blue shaded region, which provides a crucial level for buyers to defend if the price retraces. While the pair faced some selling pressure near the 152.000 resistance level, suggesting a possible consolidation or temporary profit-taking, the overall trend remains positive. The volume appears steady, with no significant surges in either direction, which indicates a balanced market but suggests that traders are waiting for further confirmation before making larger moves. Meanwhile, the Relative Strength Index (RSI) sits at 67.65, approaching overbought territory but still within range to support further gains. This RSI level indicates that bullish momentum is still strong, though a short-term cooling or pullback may occur before another push higher. As long as the RSI remains above 50, the market will likely maintain its upward bias. However, caution is warranted as the pair nears overbought levels, which could lead to a brief period of consolidation before a breakout. Traders will be closely watching for a clear break above the 152.000 resistance, which could confirm further upside potential, while any dip below the 151.491 support zone or the Ichimoku cloud could signal a weakening of the current trend. Overall, the USD/JPY remains firmly in bullish territory, with strong support from the Ichimoku cloud and key levels, and despite potential short-term consolidation, the broader trend points toward further gains if the pair can break above the critical resistance zone.
CADCHF
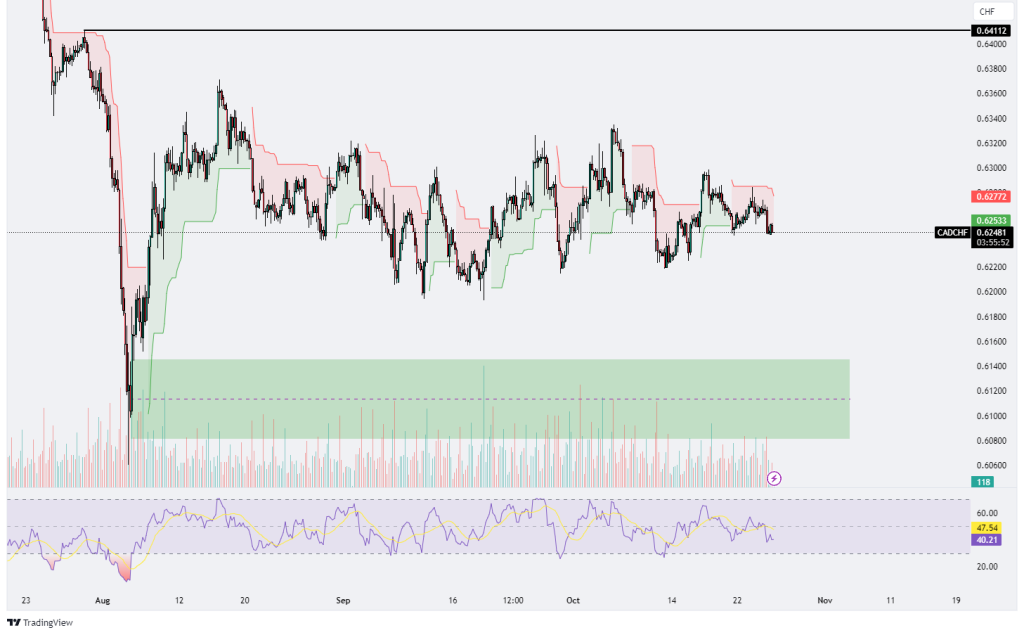
The CAD/CHF chart currently depicts a market that is trapped in a range-bound consolidation phase, with no clear directional bias. The price is trading near the support level around 0.62533, just above the key support zone at 0.62400, which has proven to be a significant level for buyers. If the price breaks below this level, it could trigger a more substantial bearish move, but for now, the support remains intact. On the upside, the pair faces resistance at 0.62772, a level where selling pressure has consistently prevented the price from advancing. Should the price break through this resistance, the next key resistance level is around 0.64112, though that is a much higher target that has not been tested in recent sessions. The Ichimoku cloud provides additional insight, as the price is trading just below the cloud, which has been alternating between red and green, reflecting indecision and a lack of clear momentum in either direction. The flat and thin nature of the cloud further reinforces the idea that the market is consolidating without a strong trend. Volume remains relatively low and stable, indicating that traders are waiting for more decisive movements before entering the market with conviction. Meanwhile, the Relative Strength Index (RSI) sits at 47.54, just below the neutral 50 level, suggesting that neither buyers nor sellers have control of the market at this time. The neutral RSI aligns with the overall sideways price action, signaling a lack of immediate momentum or overbought/oversold conditions. Given the current technical setup, the CAD/CHF pair is likely to remain range-bound until a significant breakout occurs. A break below the support at 0.62400 could lead to further downside, while a break above the resistance at 0.62772 could signal the beginning of a bullish move, with 0.64112 as the next potential target. Until such a breakout materializes, the market is expected to continue trading sideways, with traders closely watching these key support and resistance levels for signals of the next significant move.
EURAUD
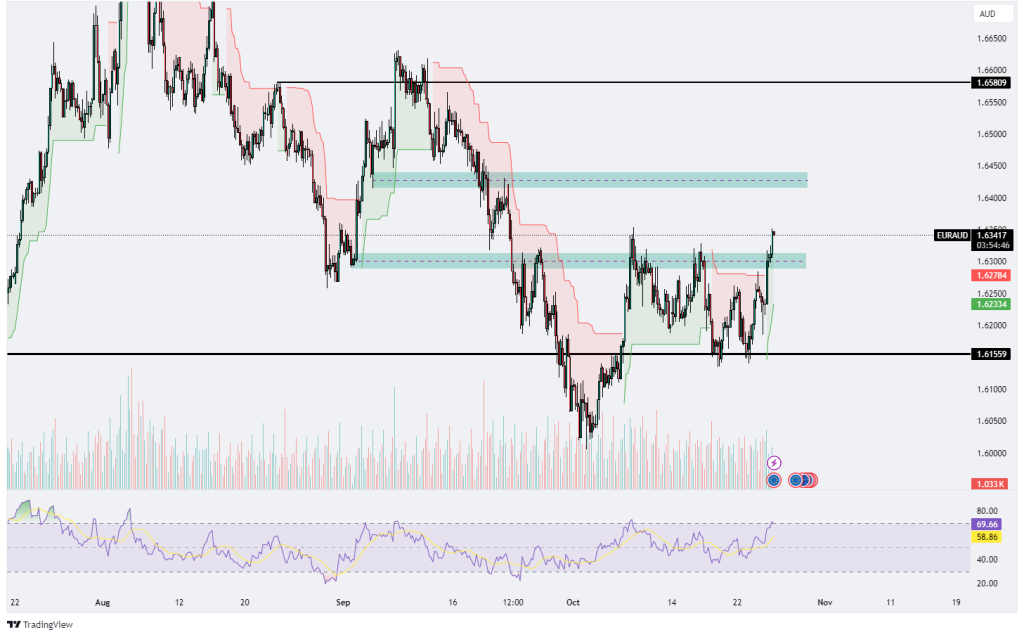
The EUR/AUD chart is showing strong signs of a bullish breakout after a period of range-bound consolidation, with the price currently trading around 1.63419, having broken through a key resistance level near 1.63000. This level had previously acted as significant resistance, and its recent breach suggests that bullish momentum is building, potentially leading to further gains. Below, there is solid support at 1.61559, which has served as a reliable floor during past rejections and will be a crucial level to watch if the market pulls back. The price action is also well above the Ichimoku cloud, which is transitioning from red to green, indicating the start of a bullish trend. The cloud has shifted from acting as resistance during the consolidation phase to now providing support, reinforcing the upward move. The bullish sentiment is further supported by a noticeable increase in volume during the recent price surge, indicating that buyers are entering the market with confidence. This volume spike adds weight to the breakout, signaling strong market participation. The Relative Strength Index (RSI) is currently sitting at 69.72, just below the overbought threshold of 70, suggesting that while the bullish momentum is strong, the pair is approaching overbought conditions. This could indicate a potential short-term consolidation or minor pullback before the next leg higher. However, the overall upward trend remains intact as the RSI supports continued strength in the market. Looking ahead, the next significant resistance level to watch is around 1.65809, a previous swing high that could act as the next target for the ongoing bullish move. Should the price fail to maintain its breakout, the support at 1.61559 will be key in preventing a deeper correction. Overall, the EUR/AUD pair appears to be in the early stages of a bullish breakout, supported by increasing volume, a bullish shift in the Ichimoku cloud, and strong momentum indicated by the RSI, with the potential for further upside as long as key support levels hold.
.png)

.png)


