

FX Market Update: USD/CAD Rebounds, GBP/AUD Rally Faces Resistance, USD/JPY & GBP/JPY at Key Levels
USDCAD
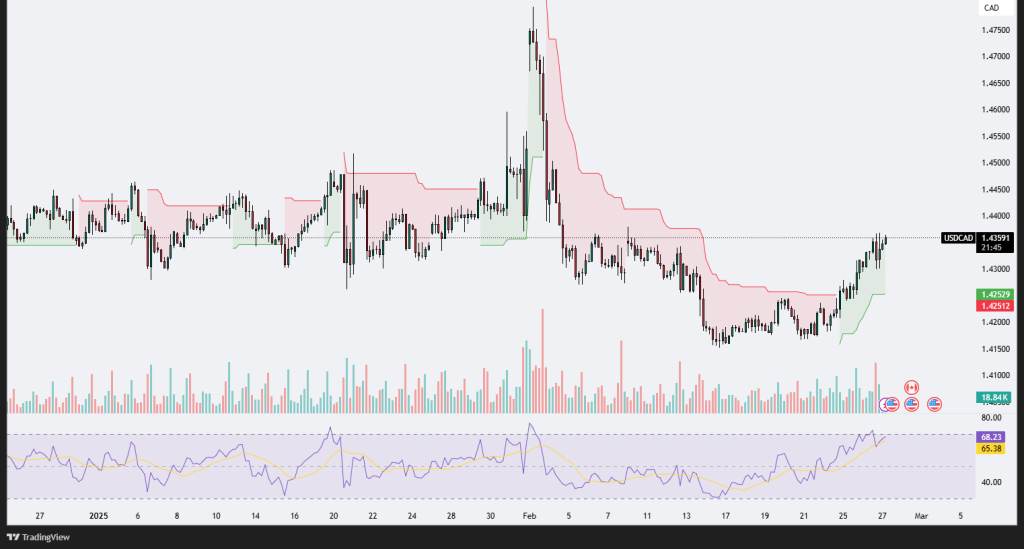
The USD/CAD chart shows a strong bullish rebound following a prolonged downtrend, with price action reclaiming higher levels near 1.4359. The Supertrend indicator has shifted from red to green, signaling a potential shift in market sentiment from bearish to bullish. This move suggests that buyers are gaining control after an extended period of weakness. The price is approaching a key resistance zone, and a breakout above 1.4400 could indicate further upside momentum. However, a failure to break this level may lead to consolidation or a possible pullback.
The Relative Strength Index (RSI) has surged to 68.21, approaching overbought territory. This suggests that while buying pressure remains strong, a potential retracement or temporary exhaustion could be on the horizon. If the RSI crosses above 70, it could indicate an overheated market, leading to a short-term correction. Volume has increased, confirming the strength behind the recent rally, but traders should monitor whether this momentum sustains or starts to fade.
Key support lies around 1.4250-1.4200, which previously acted as resistance and could now serve as a retest zone if a pullback occurs. On the upside, 1.4400-1.4450 remains a crucial resistance area. A clear breakout above this level could trigger further bullish continuation toward 1.4600. However, if price action shows rejection, we may see some consolidation before another leg higher or a possible trend reversal. Overall, USD/CAD is in a bullish phase, but caution is advised as the RSI nears overbought levels. Traders should watch for a breakout confirmation or signs of weakening momentum before making decisive moves.
USDJPY
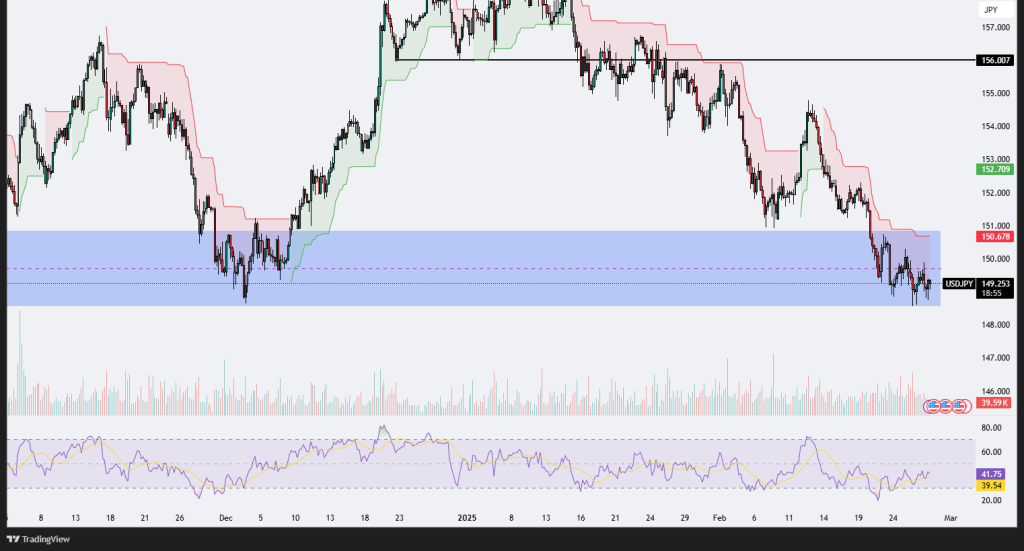
The USD/JPY chart reflects a clear bearish trend with price action consolidating around the 149.25 level, which is within a significant demand zone marked in blue. The pair has been in a downtrend since mid-January, with consecutive lower highs and lower lows, confirming strong selling pressure. The Supertrend indicator remains red, signaling a continued bearish bias. However, price is currently testing a key support zone between 148.50 and 150.00, an area that previously acted as strong support in December before initiating a bullish rally.
Volume has increased during the recent decline, suggesting stronger participation in the downtrend. However, there is some evidence of accumulation as buyers attempt to hold the 149.00-150.00 range. If the price holds above this demand zone, we could see a potential bullish reversal attempt, possibly targeting 150.70 and 152.70 levels as resistance. On the other hand, a decisive breakdown below 148.50 would likely accelerate the downtrend toward the 146.00 region.
The Relative Strength Index (RSI) is currently at 39.54, indicating oversold conditions but still lacking a strong bullish divergence. If RSI starts trending above 50, it may indicate a shift in momentum favoring buyers. Traders should closely watch whether price can reclaim 150.70, which could confirm a reversal, or if it breaks below 148.50, leading to further selling. Overall, USD/JPY remains bearish, but this support zone could be pivotal for a possible short-term rebound or further downside continuation.
GBPAUD
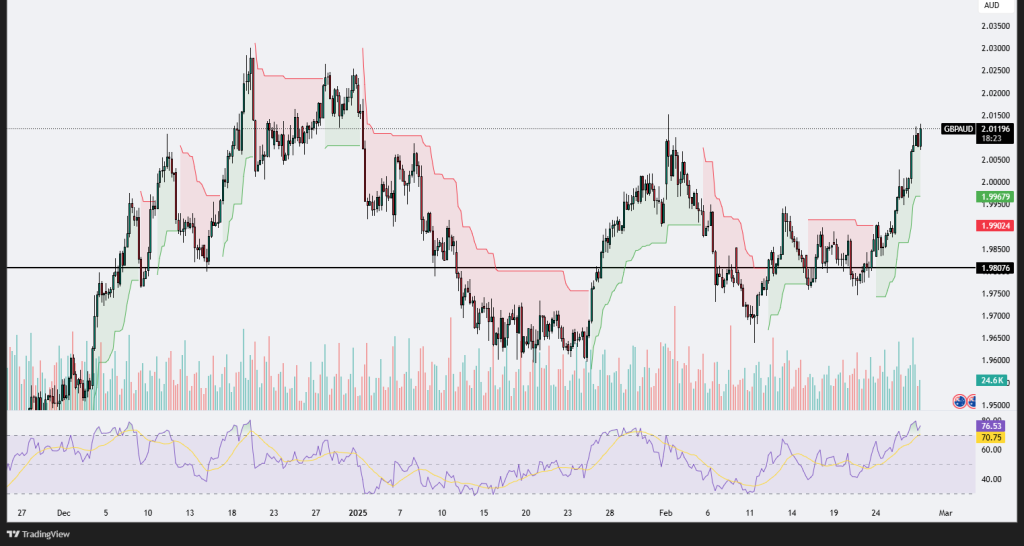
The GBP/AUD chart reflects a clear bullish trend, with price action breaking above the key 1.9800 resistance level and currently consolidating near 2.0116. The pair has been in an uptrend since late February, forming higher highs and higher lows, confirming strong buying pressure. The Supertrend indicator remains green, signaling a continued bullish bias. However, price is now approaching a potential resistance zone near 2.0150-2.0200, an area where sellers previously showed interest in early February before the last major pullback.
Volume has increased significantly during this latest rally, indicating strong participation in the uptrend. This surge in volume suggests that buyers are still in control, pushing the price higher with momentum. However, the Relative Strength Index (RSI) is currently at 76.28, signaling overbought conditions. While this doesn’t necessarily mean an immediate reversal, it does suggest that a short-term pullback could be possible before another leg higher. If price sustains above 2.0000, we could see a continuation towards 2.0300 and 2.0500 as potential upside targets. On the other hand, if sellers step in and push price below 1.9950, a deeper retracement towards the 1.9800 support zone could unfold.
The RSI will be key in confirming the next move. If it remains above 70 but starts forming bearish divergence, it could signal exhaustion in the uptrend. However, if price continues making new highs while RSI stabilizes, momentum may stay strong. Traders should closely watch how price reacts near 2.0150-2.0200—a breakout above this level could confirm further upside, while rejection could lead to a short-term correction. Overall, GBP/AUD remains bullish, with momentum favoring buyers, but key resistance levels may determine whether the rally continues or if a pullback is due.
GBPJPY
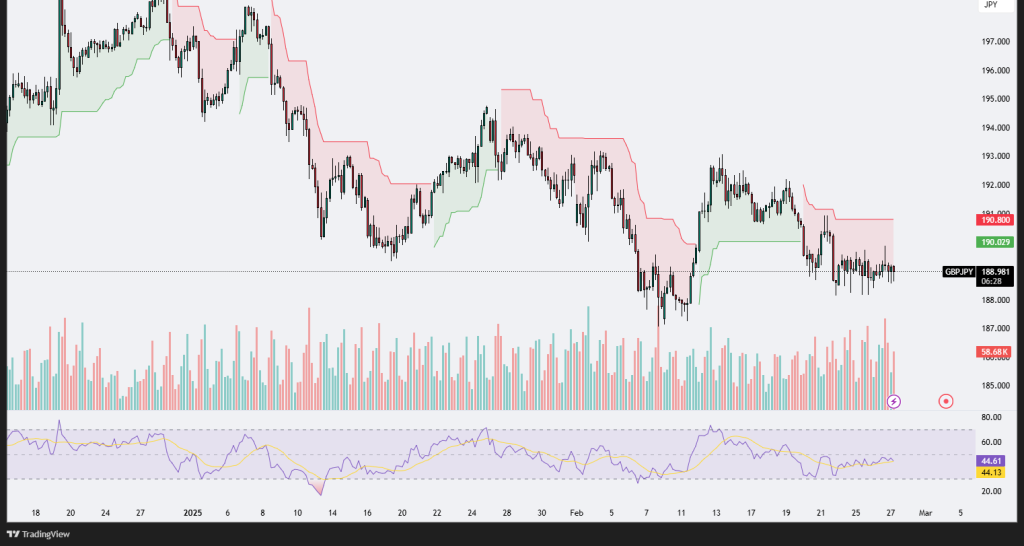
The GBP/JPY 4-hour chart presents a sideways consolidation phase following a broader downtrend. The price is currently trading around 188.978, struggling to break above the resistance zone near 190.029, with a higher resistance level at 190.800. The Supertrend indicator remains red, indicating a bearish bias, while price action is forming lower highs, suggesting continued selling pressure. The market recently experienced a sharp decline, followed by a consolidation period, which could either signal accumulation before a reversal or a continuation pattern before another leg down.
The volume profile shows a notable spike in recent trading sessions, particularly during the latest downward movement, indicating strong selling interest. However, the volume has since declined as price consolidates, suggesting that neither buyers nor sellers are currently in full control. A break below 188.500 could lead to a retest of lower levels, potentially around 187.000, while a breakout above 190.029 may push GBP/JPY towards 190.800 and beyond.
Looking at the Relative Strength Index (RSI), currently at 44.57, it remains below the 50 neutral level, reflecting weak bullish momentum. The RSI has been hovering in the 40-50 range, suggesting that price lacks strong buying pressure to push higher. If RSI drops below 40, it could confirm a further bearish continuation. However, if it reclaims 50-55, it might signal renewed bullish momentum.
Overall, GBP/JPY remains in a weak consolidation phase, with no clear trend direction at the moment. The market needs a decisive breakout from this range to confirm the next move. A bullish breakout above 190.029 could invalidate the bearish structure, while a breakdown below 188.500 may lead to further downside continuation. Traders should monitor volume and RSI closely for confirmation of the next significant price movement.
.png)

.png)


