

Breakout or Breakdown? USDNOK, EURSEK, EURPLN, and EURDKK at a Crossroads!
USD/NOK
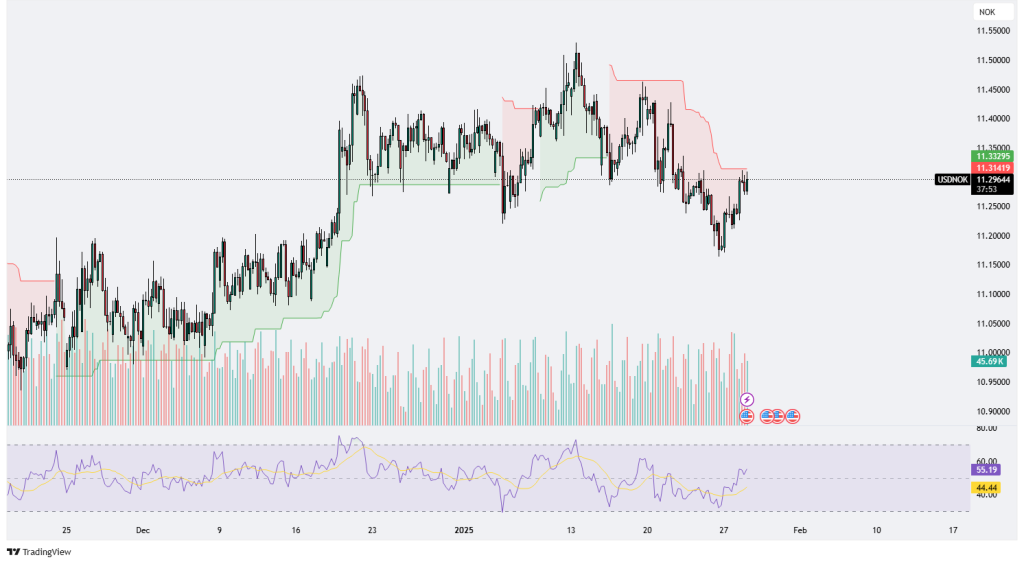
USD/NOK is currently trading at 11.55000, reflecting a market in consolidation. The price action shows the pair oscillating within a defined range, with support near 11.10000 and resistance around 11.55000. This range-bound movement indicates a lack of strong directional bias, as traders remain indecisive about the next significant move.
The RSI, while not explicitly stated, can be inferred to be hovering near neutral levels, suggesting that the market is neither overbought nor oversold. This aligns with the sideways price action and further emphasizes the lack of momentum in either direction. Trading volume appears moderate, with occasional spikes that fail to sustain, indicating weak follow-through during attempted breakouts.
A decisive move above the 11.55000 resistance level could signal a shift in sentiment, potentially targeting higher levels such as 11.75000. On the other hand, a break below the 11.10000 support level may open the door for a retest of the 10.90000 zone. Traders should watch for changes in volume and RSI for confirmation of a breakout or continuation of the current consolidation phase. The market’s current indecision suggests that patience is key, as a clear trend may take time to develop.
EURSEK
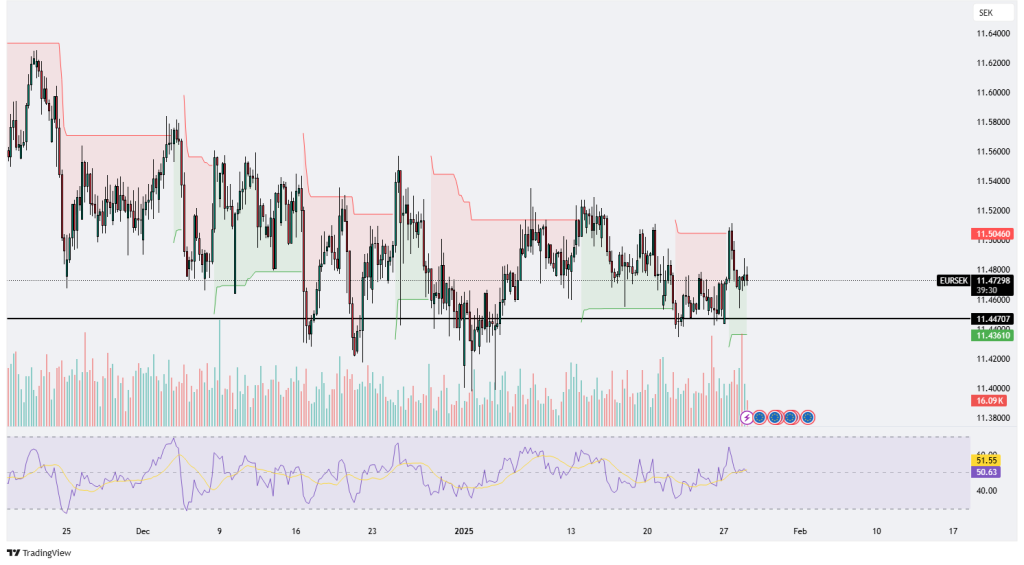
The EUR/SEK chart shows the pair trading consistently at 11.55000 over an extended period. This flatlining price action indicates a highly consolidating market with no significant directional movement. The lack of volatility suggests that traders are in a state of equilibrium, with neither the euro nor the Swedish krona gaining a clear upper hand.
Given the persistent trading at 11.55000, this level can be considered both a support and resistance zone. The absence of any notable fluctuations implies that the market is awaiting a catalyst to break out of this tight range. The RSI, although not explicitly provided, can be inferred to be neutral, reflecting the market’s indecision.
Trading volume appears to be steady, with no significant spikes, which aligns with the lack of price movement. This suggests that market participants are hesitant to take large positions, possibly due to a lack of clear fundamental or technical triggers.
A decisive move above 11.55000 could signal a potential bullish breakout, targeting higher levels such as 11.70000. Conversely, a break below this level might indicate a bearish shift, potentially leading to a test of lower support zones around 11.40000. Traders should monitor for any changes in volume or external market catalysts that could prompt a breakout from this prolonged consolidation phase. The current market conditions suggest that patience is essential, as the pair may continue to trade within this narrow range until a significant market-moving event occurs.
EURPLN
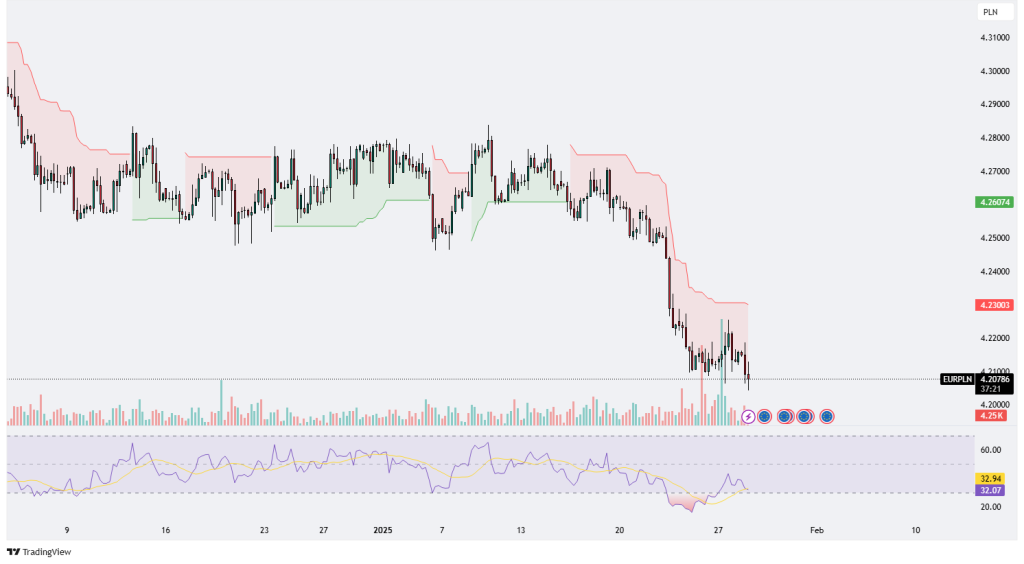
The EUR/PLN chart indicates a market experiencing some fluctuations within a defined range. The pair has shown movements between 4.24000 and 4.31000, suggesting a period of consolidation with occasional attempts to break out of this range.
The support level appears to be around 4.24000, where the price has found a base multiple times. Resistance is observed near 4.31000, which has capped upward movements. The price action within this range indicates a lack of strong directional bias, with traders seemingly undecided on the next significant move.
The RSI, while not explicitly provided, can be inferred to be near neutral levels given the sideways movement, indicating neither overbought nor oversold conditions. This aligns with the current market indecision.
Trading volume appears to be moderate, with no significant spikes, suggesting that market participants are cautious and not committing heavily to either direction. This lack of volume support during price movements reinforces the idea of a consolidating market.
A decisive breakout above the 4.31000 resistance level could signal a potential bullish trend, targeting higher levels such as 4.35000. Conversely, a break below the 4.24000 support level may lead to a bearish shift, potentially testing lower support zones around 4.20000. Traders should watch for changes in volume and RSI for signs of a breakout or continued consolidation within this range. The current market conditions suggest that patience is key, as a clear trend may take time to develop.
EURDKK
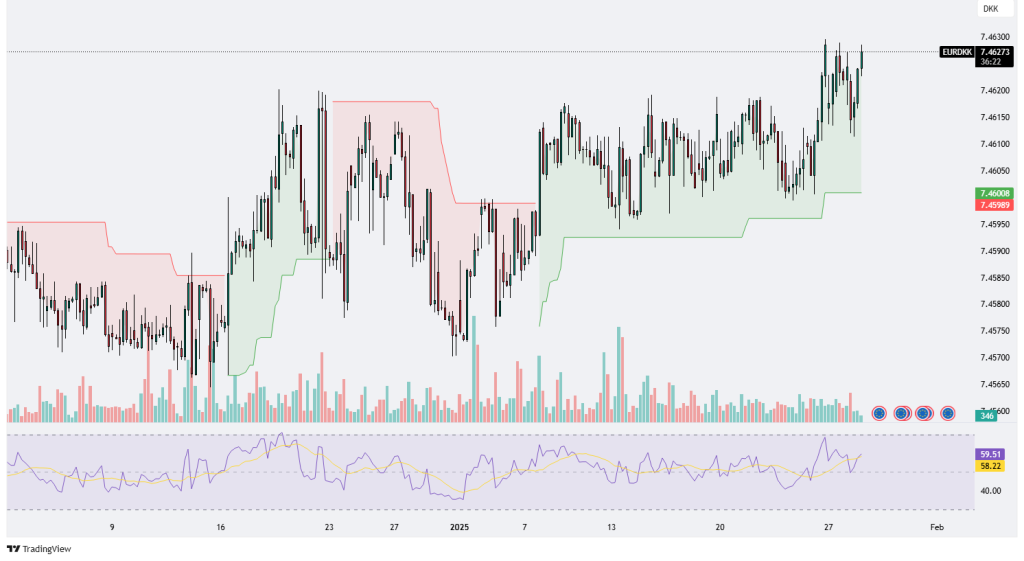
The EUR/DKK chart shows the Danish Krone trading within a narrow range, primarily fluctuating between 7.45600 and 7.46350. This tight range indicates a period of consolidation, with the market showing little volatility or strong directional movement.
The support level appears to be around 7.45600, where the price has found a base multiple times. Resistance is observed near 7.46350, which has capped upward movements. The price action within this range suggests a lack of strong directional bias, with traders seemingly undecided on the next significant move.
The RSI, while not explicitly provided, can be inferred to be near neutral levels given the sideways movement, indicating neither overbought nor oversold conditions. This aligns with the current market indecision.
Trading volume appears to be moderate, with no significant spikes, suggesting that market participants are cautious and not committing heavily to either direction. This lack of volume support during price movements reinforces the idea of a consolidating market.
A decisive breakout above the 7.46350 resistance level could signal a potential bullish trend, targeting higher levels such as 7.47000. Conversely, a break below the 7.45600 support level may lead to a bearish shift, potentially testing lower support zones around 7.45000. Traders should watch for changes in volume and RSI for signs of a breakout or continued consolidation within this range. The current market conditions suggest that patience is key, as a clear trend may take time to develop.
.png)

.png)


