

Key Levels and Trends for NASDAQ, EURNZD, EURAUD, and GBPAUD
Analysis
NASDAQ
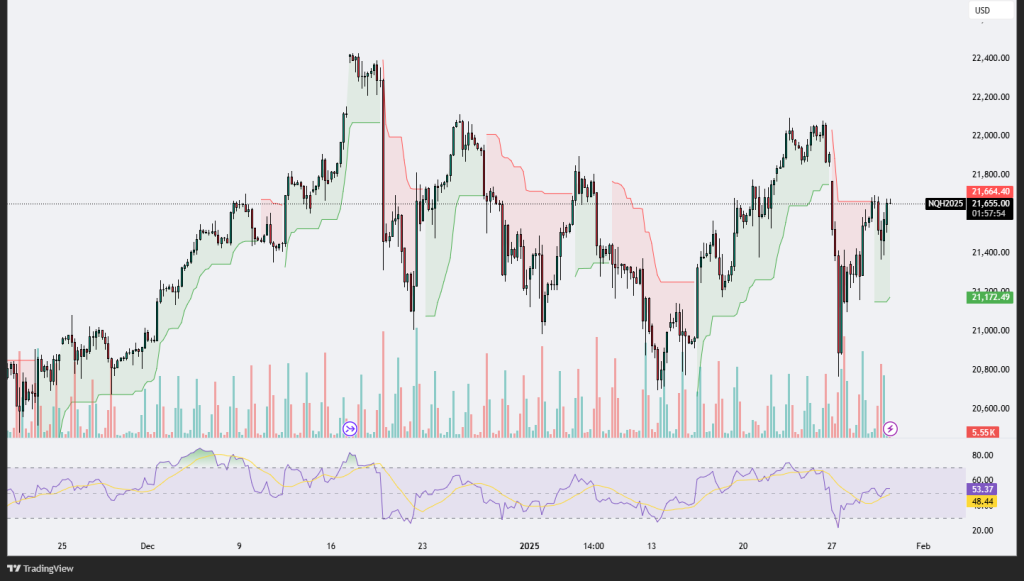
The chart for NQ2025 shows a market attempting to recover from recent declines, currently trading around 21,654.50. The Supertrend indicator reflects a transition from bearish to bullish sentiment as the price recently moved above the green Supertrend line at 21,172.49. However, the price remains near a key resistance zone at 21,664.40, which aligns with previous instances of selling pressure. The volume analysis indicates a notable spike during the recent upward move, signaling renewed interest among buyers, but the lower volume in subsequent candles suggests that momentum may be waning.
The RSI is currently at 53.35, just above the neutral level of 50, indicating mild bullish momentum but not an overbought condition. This suggests the market could continue its upward trajectory if supported by higher volumes and sustained buying interest. However, the failure to break above the resistance level convincingly might result in consolidation or a potential retracement toward the 21,172.49 level, which now acts as a support zone.
Traders should watch for a breakout above 21,664.40 to confirm further bullish momentum, with potential upside targets near 22,000. Conversely, a breakdown below the support could signal the resumption of a bearish trend. The market’s behavior at these critical levels will likely dictate the short-term trend, making volume and RSI movement key indicators to monitor.
EURNZD
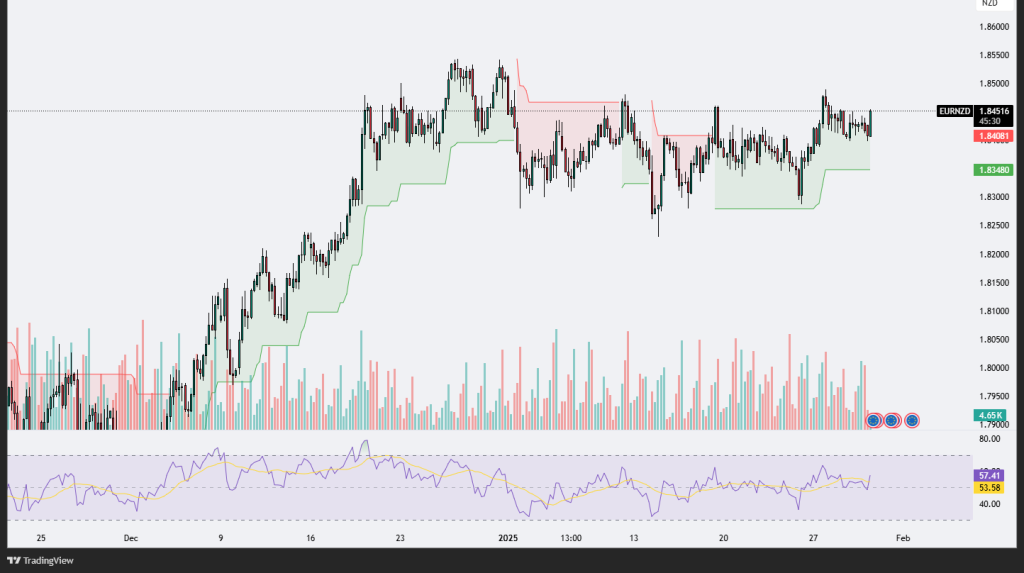
The EURNZD chart shows a market currently trading near the 1.8450 level, with a consolidative price action pattern over the past sessions. The Supertrend indicator reveals mixed signals, as the price has alternated between bullish and bearish zones, reflecting the market’s indecisiveness. Support appears to be holding firm around the 1.8348 level, while resistance near 1.8450 is acting as a significant barrier for upward momentum. Volume has been relatively stable but lacks the strength needed to break out of the consolidation range convincingly.
The RSI is currently at 57.41, indicating mild bullish momentum but not at overbought levels, suggesting the potential for further upside if buying interest picks up. However, the failure of recent attempts to break above resistance points to a lack of strong bullish conviction. If the price manages to sustain above 1.8450, it could open the door for a move toward the next resistance zone around 1.8500 or higher. Conversely, a breakdown below 1.8348 could signal a reversal, potentially targeting the 1.8300 level or lower.
Traders should watch for a breakout from the current consolidation range to confirm the next directional move. A bullish breakout above resistance would require increased volume and sustained momentum, while a bearish move below support could indicate a deeper correction. The overall structure suggests a market awaiting a catalyst for its next significant move.
EURAUD
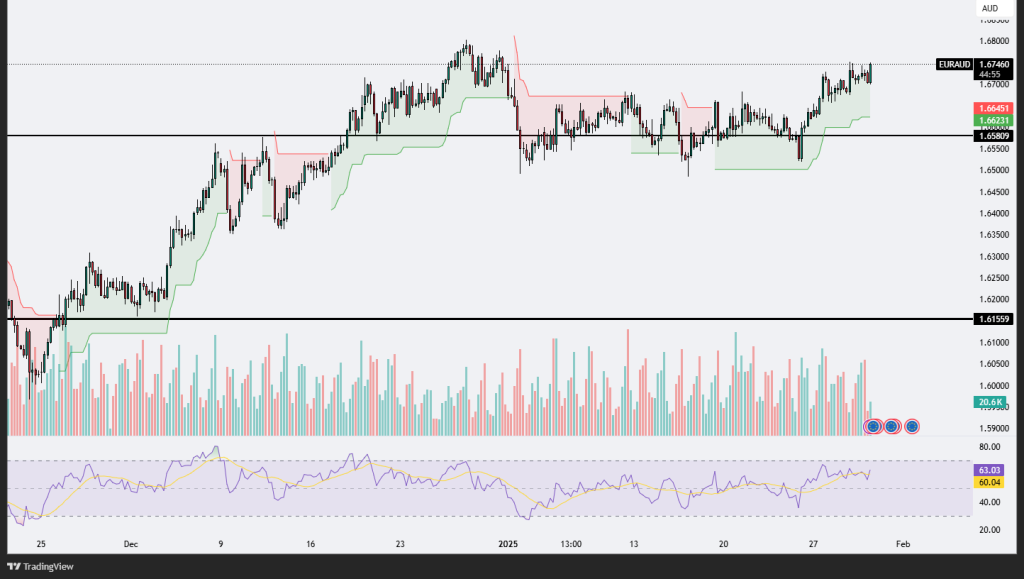
The EURAUD chart demonstrates a bullish momentum as the price is trading near the upper end of its range at 1.6745. The Supertrend indicator has maintained a green zone, signifying the continuation of upward pressure. The price has broken out from the 1.6623 level, which acted as a resistance previously and now serves as a support level. If the bullish momentum persists, the price could test higher levels around 1.6800.
Volume analysis indicates steady trading activity, but a significant spike in volume could strengthen the bullish case, suggesting that buyers remain in control. The RSI is currently at 62.93, signaling bullish momentum but still within non-overbought conditions, providing room for further upside movement. However, traders should note that the RSI is approaching overbought levels, which could lead to a short-term retracement if buying pressure weakens.
On the downside, if the price fails to sustain above the 1.6623 support level, it may retreat toward the 1.6580 level, which has acted as a significant support in the past. Overall, the trend remains bullish, and further price action should confirm whether the pair can maintain its upward trajectory or face consolidation in the near term.
GBPAUD
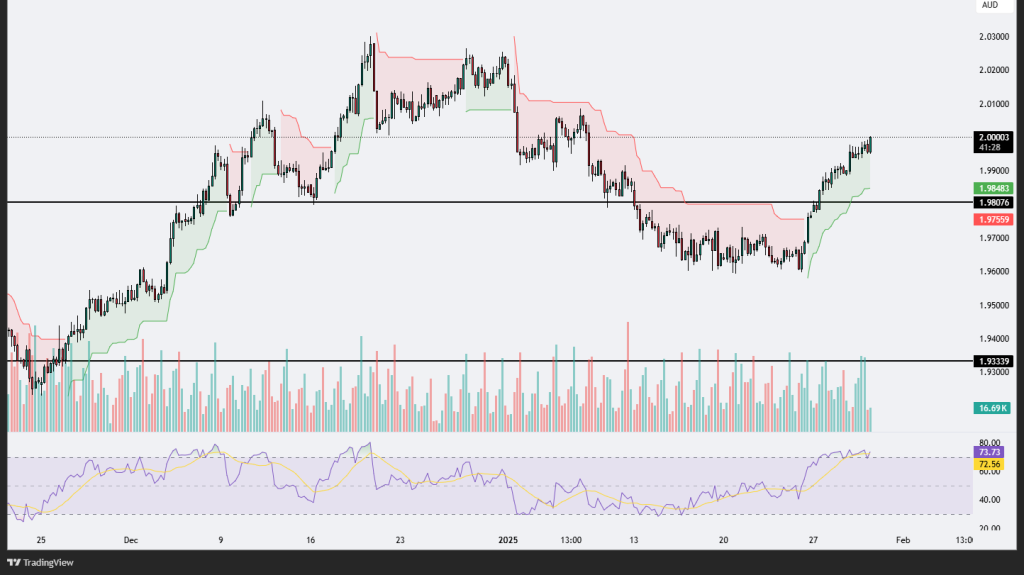
The GBPAUD chart shows a strong bullish trend, with the pair currently trading at the psychological level of 2.0000. This level often acts as a key resistance zone, and a breakout above it could indicate a continuation of the upward momentum. The Supertrend indicator is firmly in the green, reflecting bullish sentiment in the market. The pair has seen a significant recovery from the support level at 1.9333, with steady upward movement marked by higher highs and higher lows.
The RSI is at 73.72, indicating overbought conditions. This suggests that while the bullish momentum is strong, a potential short-term pullback or consolidation could occur as traders take profit. The recent volume spike suggests strong buying interest, further validating the bullish sentiment. However, traders should watch for potential resistance at the 2.0000 level, as failure to break above this could lead to a retest of the nearest support zones at 1.9848 or 1.9807.
In summary, the trend remains strongly bullish, but caution is advised due to overbought RSI levels and the proximity to a key psychological resistance. A confirmed breakout above 2.0000 with strong volume could pave the way for further gains, while failure to hold above could result in a retracement toward lower support levels.
.png)

.png)


