
Technical Analysis 30.12.2024
EURUSD
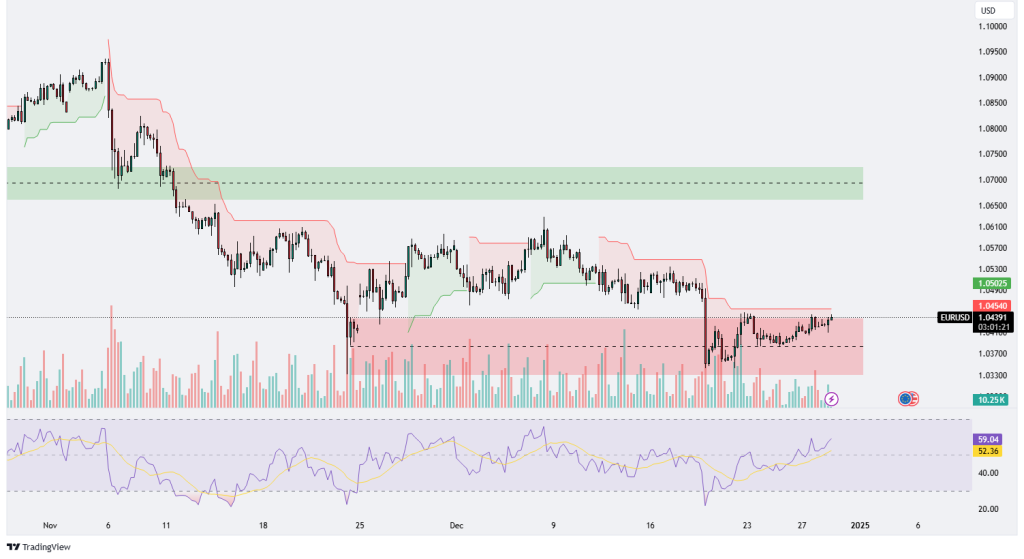
The EUR/USD chart exhibits a consolidation phase within a well-defined range, as the price oscillates between the lower boundary at 1.0370 and the upper resistance near 1.0500. The Ichimoku cloud structure suggests ongoing indecision, as the price remains capped by the red cloud, indicating a bearish bias. However, buyers are showing resilience, defending the lower support levels, which aligns with the recent increase in volume near the bottom of the range. The RSI has been gradually rising, currently at 52.36, reflecting a mild bullish momentum, though it remains neutral overall.
The price action suggests that the pair is gearing up for a potential breakout. A decisive close above 1.0500 would likely trigger further upside toward the green resistance zone around 1.0650, supported by renewed buying interest. Conversely, a break below 1.0370 could invalidate the bullish scenario, opening the door for a move toward lower levels around 1.0300 or even 1.0200. The flat nature of the moving averages and the lack of directional bias in the RSI emphasize the importance of waiting for a breakout confirmation before committing to any directional trades.

GBPUSD
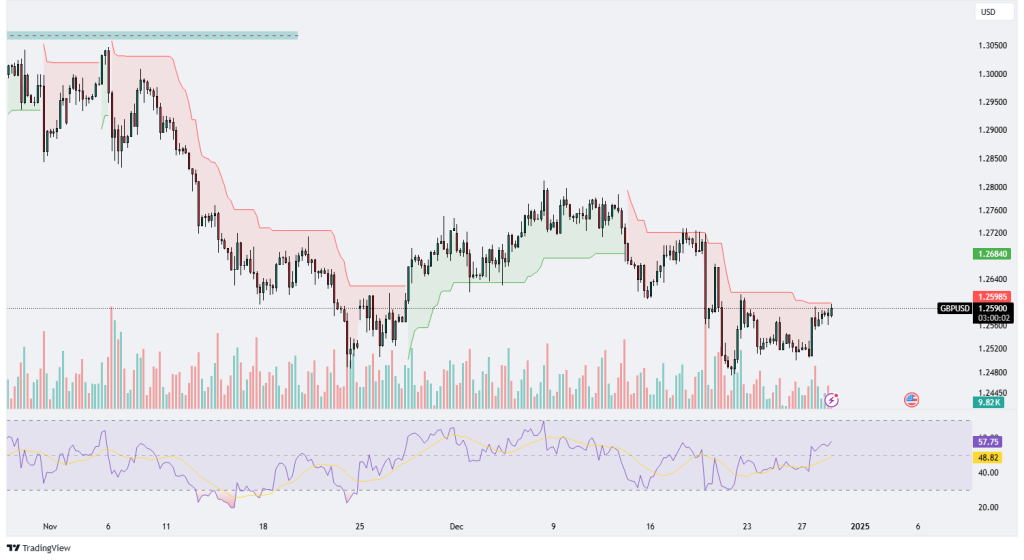
The GBP/USD chart indicates a consolidating trend, with the price attempting to recover from its prior decline. The Ichimoku cloud shows a bearish setup as the price remains below the cloud, signaling resistance near the 1.2680 level. Despite this, the recent price action has shown reduced downward momentum, as evidenced by the lower volume during the recent dips, suggesting potential accumulation by buyers. The RSI currently stands at 57.71, leaning toward bullish territory, which indicates growing positive momentum but not yet in overbought conditions, leaving room for further upward movement.
The price appears to be forming a base around the 1.2590 level, with resistance overhead near 1.2680. A breakout above this resistance could confirm a reversal, targeting levels around 1.2750 or higher. Conversely, failure to breach the resistance might result in another test of the lower support zones near 1.2520 or even 1.2440 if bearish pressure intensifies. The current setup highlights the importance of monitoring key levels and waiting for confirmation of directional bias before entering trades, as the pair is on the cusp of determining its next significant move.
XAUUSD
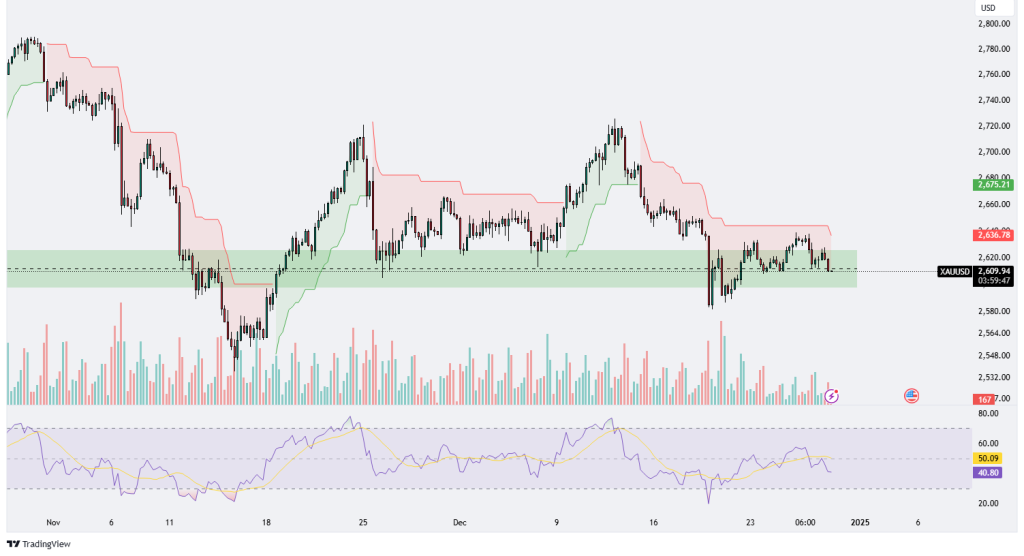
The XAU/USD chart demonstrates a bearish bias as the price remains below the Ichimoku cloud, which serves as overhead resistance, with the cloud’s span reflecting a downward trajectory. The support zone around 2,600 – 2,620, marked by the green shaded area, appears to be holding for now, but persistent selling pressure suggests a potential retest of these levels. Volume analysis shows decreasing activity during the recent consolidation phase, implying reduced buyer interest and a lack of momentum for an upward breakout.
The RSI has declined to 40.79, indicating increasing bearish momentum, but it has not yet reached oversold levels, suggesting room for further downward movement. A breakdown below the 2,600 level could trigger significant bearish continuation, potentially targeting 2,580 or lower. On the other hand, a sustained rebound from the current support zone might push the price toward the 2,640 – 2,675 resistance zone, but such a scenario would require strong buying volume to overcome the prevailing bearish sentiment. Overall, the chart signals caution for buyers, with sellers maintaining control as long as the price remains below the Ichimoku cloud and key resistance levels.
XAGUSD
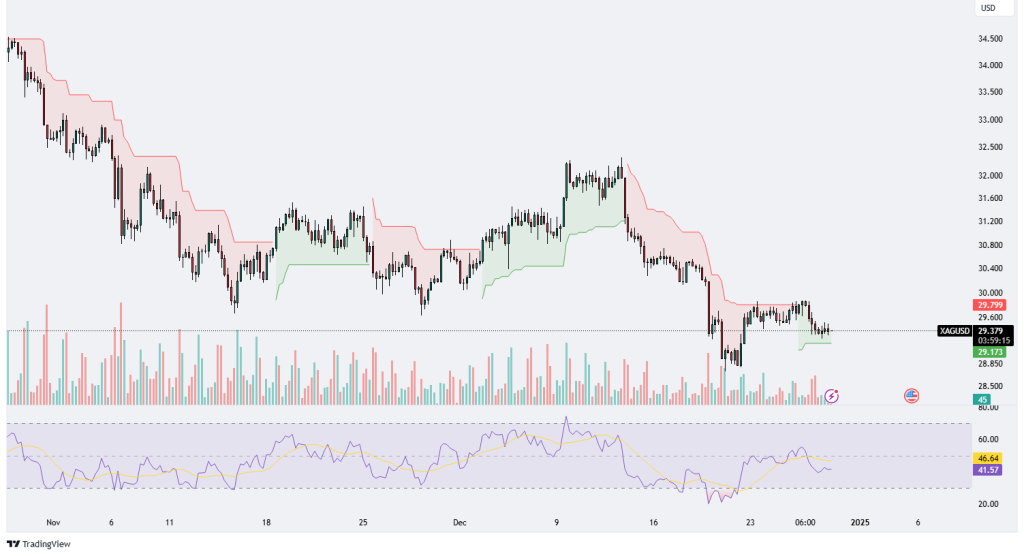
The XAG/USD chart reflects a sustained bearish bias as prices remain below the Ichimoku cloud, signaling continued downward pressure. The price is hovering near the $29.17 level, a crucial support zone that has previously acted as a floor for the market. The consolidation around this area suggests indecision among traders, but the lack of significant bullish volume reinforces the probability of a further downward breakout. The Ichimoku cloud’s span is sloping downward, indicating persistent selling momentum and a lack of upward strength.
The RSI is currently at 41.66, reflecting bearish momentum but not yet reaching oversold levels, leaving room for potential downside continuation. The declining trading volume during the recent consolidation phase implies waning interest from buyers, which could exacerbate any sell-off if the support level is breached. Should the price fall below $29.17, it could pave the way for a retest of lower psychological levels, such as $28.50 or even lower. Conversely, if the support holds and a rebound occurs, the immediate resistance lies near the $29.80-$30.00 zone, which aligns with the bottom of the Ichimoku cloud. A decisive break above this area would be required to shift the market sentiment to neutral or bullish. At present, the overall market sentiment remains bearish, with the current technical indicators favoring sellers over buyers.
.png)

.png)


