

Gold, Silver at Resistance — Nasdaq Weakens, USDJPY Holds Trendline
Gold / U.S. Dollar (XAU/USD)
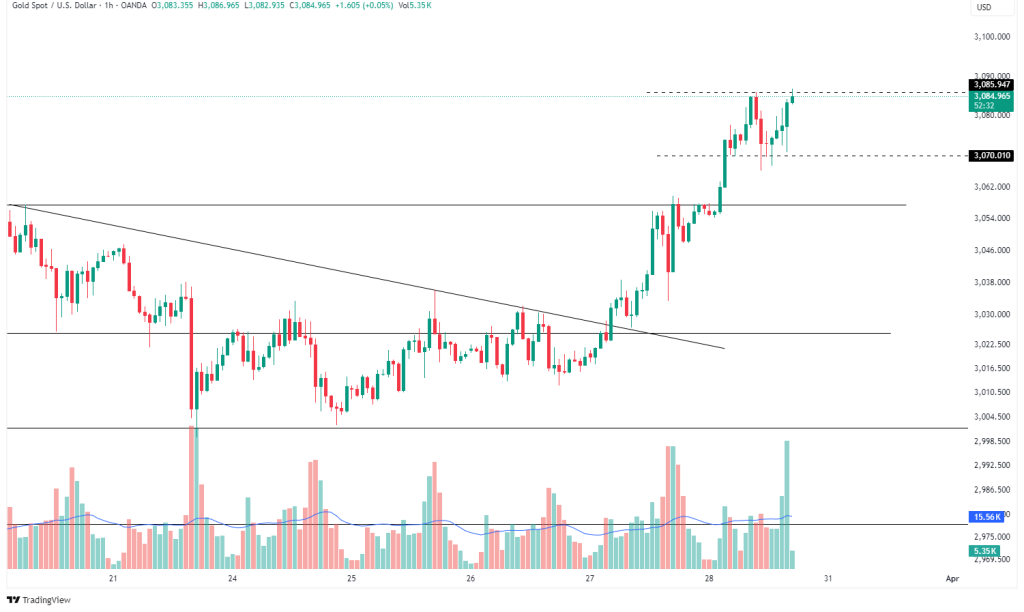
Gold Tests $3,085 After Breakout – Consolidation Ahead?
Gold broke out of a descending trendline and reached $3,085. Price action suggests consolidation or pullback before next move.
Gold (XAU/USD) has successfully broken above a descending trendline, confirming the move with sustained bullish momentum. Following the breakout, the metal has formed a bullish market structure of higher highs and higher lows, eventually testing the $3,085 resistance zone. Current price behavior shows slight hesitation near this level, hinting at a potential short-term consolidation or a minor pullback before the next directional push.
- Key Resistance: $3,085
- Key Support: $3,070
- Volume Analysis: Increasing volume during the breakout phase confirms buyer commitment.
Technical Techniques Used:
- Trendline breakout
- Support/resistance identification
- Volume confirmation
Silver / U.S. Dollar (XAG/USD)
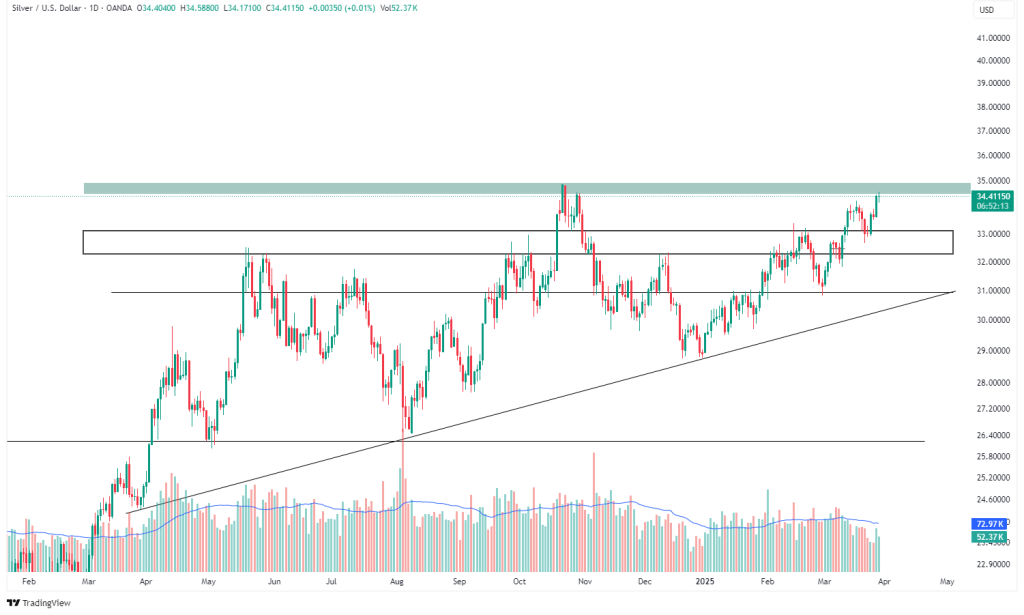
Silver Approaches $35 Ceiling – Can the Triangle Break?
Silver tests long-term resistance at $34.40–$35. An ascending triangle supports the trend, with higher lows building pressure for a breakout.
Silver (XAG/USD) is testing a major long-term resistance zone between $34.40 and $35.00, a level that has consistently acted as a strong ceiling since May 2023. The recent rally is being driven by an ascending triangle pattern, with higher lows tightening beneath horizontal resistance. This structure suggests building bullish pressure, and traders are watching closely for a confirmed breakout or a possible rejection at this significant level.
- Key Resistance Zone: $34.40–$35
- Key Support Zone: $33–$33.50
- Breakout Potential: A strong daily close above $35 could initiate a bullish rally.
Technical Techniques Used:
- Ascending triangle pattern
- Multi-timeframe resistance zone
- Volume analysis
NASDAQ 100 E-mini Futures (NDX)
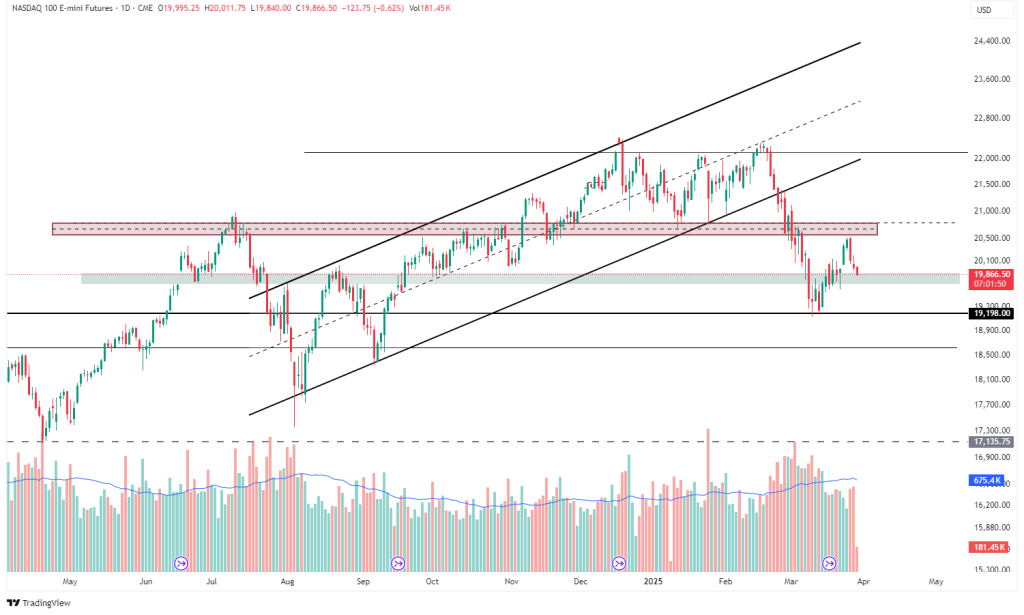
NASDAQ Breaks Channel Structure – Selling Resumes Below $20,500
NASDAQ breaks below rising channel and fails retest of $20,500 resistance. Breakdown confirms renewed bearish pressure.
NASDAQ (US100) has broken down from the rising channel it had been respecting since October 2023, marking a shift in market structure. After the breakdown, price attempted to retest the lower boundary of the channel and key horizontal resistance around $20,500, but the failure to reclaim this zone triggered renewed selling pressure. The loss of channel support confirms a bearish development, and momentum now favors sellers unless price reclaims the former structure.
- Key Resistance: $20,500
- Key Support: $19,200
- Trend Direction: Bearish below $20,500
Technical Techniques Used:
- Channel analysis
- Retest of broken support as resistance
- Horizontal support/resistance zones
USD / JPY
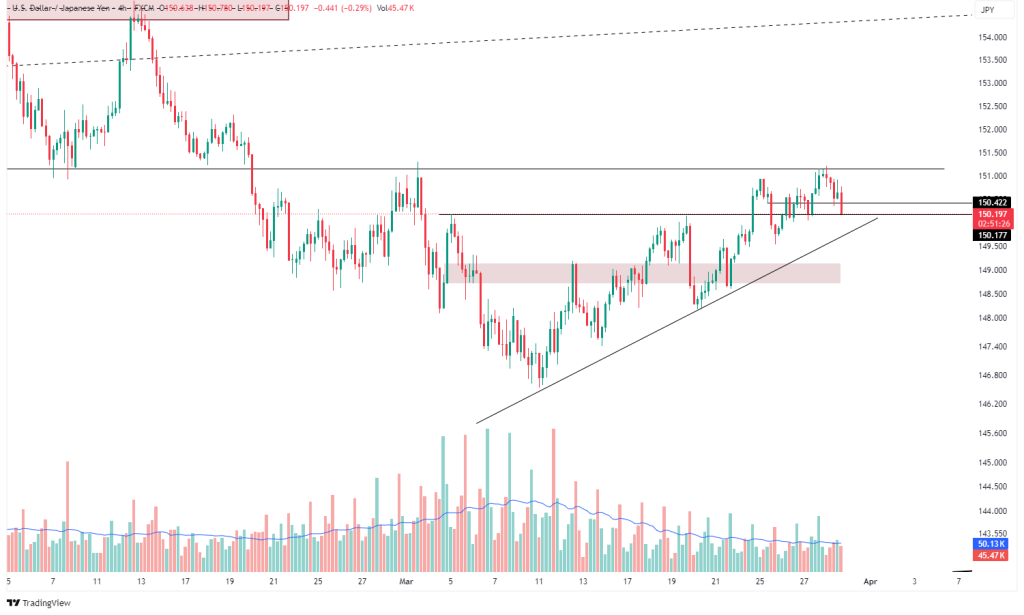
USD/JPY Forms Rising Wedge – Will 151 Keep Capping Price?
USD/JPY forms a rising wedge, now near lower trendline. Resistance at 151.00 remains firm, rejecting price on multiple occasions.
USD/JPY is developing a rising wedge pattern on the 4-hour chart, with price currently hovering near the lower trendline of the formation. Overhead, the 151.00 resistance continues to act as a significant ceiling, having rejected price multiple times. This pattern suggests potential exhaustion, and a breakdown below the wedge could signal a shift in short-term momentum, while a breakout above 151 would challenge the bearish structure.
- Key Resistance: 151.00
- Key Support (wedge trendline): ~150.00
- Risk Level: A breakdown of the rising wedge could lead to a bearish correction.
Technical Techniques Used:
- Rising wedge formation
- Horizontal resistance
- Volume divergence observation
.png)

.png)


