

TechnicalAnalysis 19.12.2024
DOW JONES INDUSTRIAL
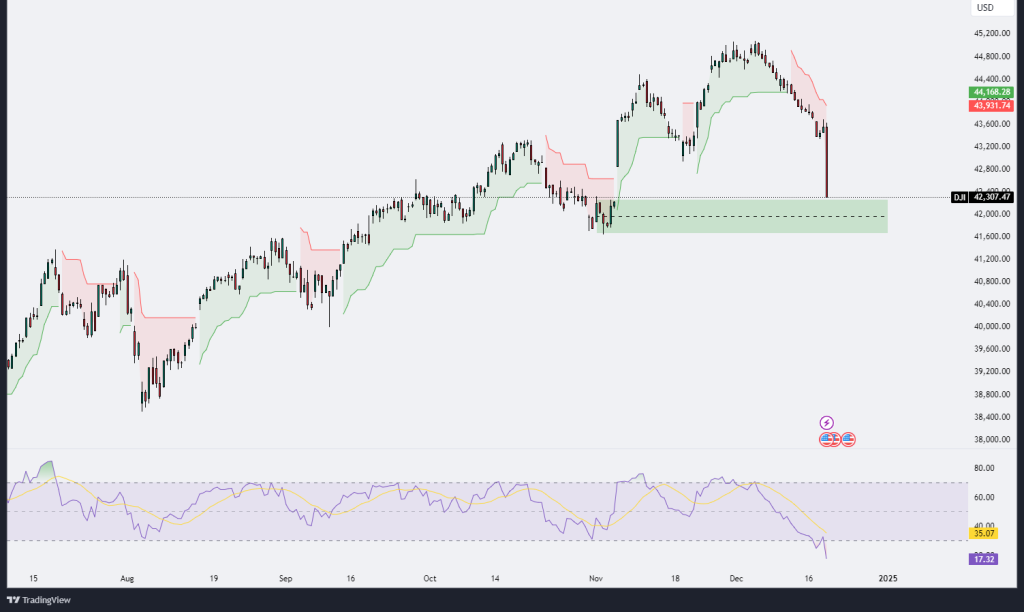
The Dow Jones Industrial Average (DJI) chart shows a sharp decline in price, with the index dropping to 42,307.47 after reaching recent highs near 44,400. This dramatic sell-off has pushed the price closer to a critical support zone around the 42,000 level, highlighted by the green shaded area, which coincides with prior consolidation levels observed in late October. This area could act as a demand zone, attracting buyers if the index stabilizes around this level.
The Ichimoku Cloud shows that the price has decisively moved below the cloud, signaling a shift to bearish momentum. The cloud itself has started to flatten and may act as a resistance barrier if the price attempts a recovery. This bearish signal is compounded by the steep downward trajectory of the price action, suggesting strong selling pressure.
The Relative Strength Index (RSI) has dropped to an extremely oversold level of 17.32, indicating that the market may be oversold in the short term. Such low RSI levels often precede a corrective bounce or at least a consolidation period as sellers lose momentum. However, it is important to note that in strong bearish trends, oversold conditions can persist for extended periods.
Volume analysis indicates a significant increase in selling activity, as evidenced by the long red candlestick and accompanying high volume. This spike in volume suggests capitulation among some market participants, but it also implies that the current sell-off may need to stabilize before any meaningful recovery can take place.
In conclusion, the DJI is experiencing strong bearish pressure, with a critical support zone near 42,000 likely to be tested soon. While oversold conditions as indicated by the RSI suggest the potential for a short-term rebound, the bearish momentum remains dominant. Traders should watch for a clear reaction around the 42,000 support area and monitor the RSI for signs of recovery. A break below this level could trigger further downside toward the 41,000 or 40,000 levels, while stabilization here could pave the way for a relief rally toward the 43,500–44,000 resistance zone.
NASDAQ
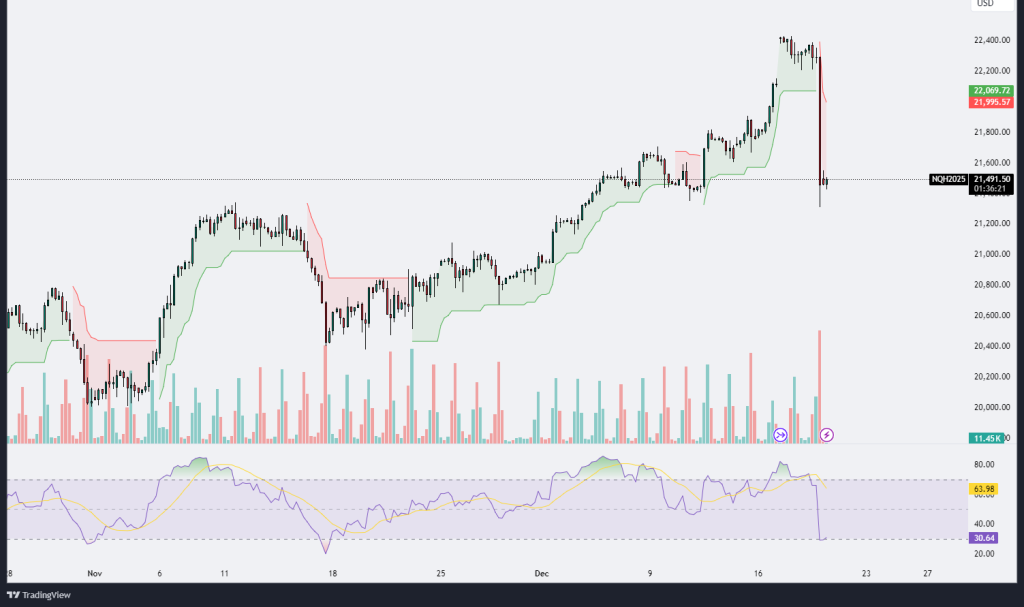
The Nasdaq Futures (NQ) chart reveals a significant bearish shift after a strong upward trend, with the price dropping sharply to 21,492.75 following a recent peak near 22,400. This decline is characterized by a large bearish candlestick, accompanied by a notable spike in trading volume, indicative of heightened selling pressure and potentially panic selling among market participants. The drop has pushed the price below the Ichimoku cloud support level, signaling a bearish reversal in market sentiment.
The Ichimoku Cloud shows that the price has decisively breached the lower boundary, with the cloud now likely acting as resistance in the near term. The rapid price action highlights the strength of the bearish momentum, suggesting that the market could experience further downside unless a strong support level is found.
The Relative Strength Index (RSI) has fallen sharply to 30.70, nearing oversold territory. This suggests that the sell-off might be overstretched in the short term, potentially paving the way for a temporary relief bounce or consolidation phase. However, given the strength of the bearish move, traders should remain cautious, as oversold conditions can persist in a strong downtrend.
From a volume perspective, the substantial increase in trading activity on the sell-off highlights strong market participation and could signify a capitulation phase. If the price stabilizes around the current levels, it may indicate the formation of a temporary bottom.
In conclusion, the Nasdaq Futures are under significant bearish pressure, with the price breaking below key support levels and the RSI indicating oversold conditions. The area around 21,400–21,500 will be critical to monitor, as it may serve as a support zone. A failure to hold this level could lead to further declines, while stabilization and reduced selling pressure could result in a rebound toward the 21,800–22,000 resistance zone. Traders should remain vigilant for signs of a reversal or continuation of the bearish trend.
GBPNOK
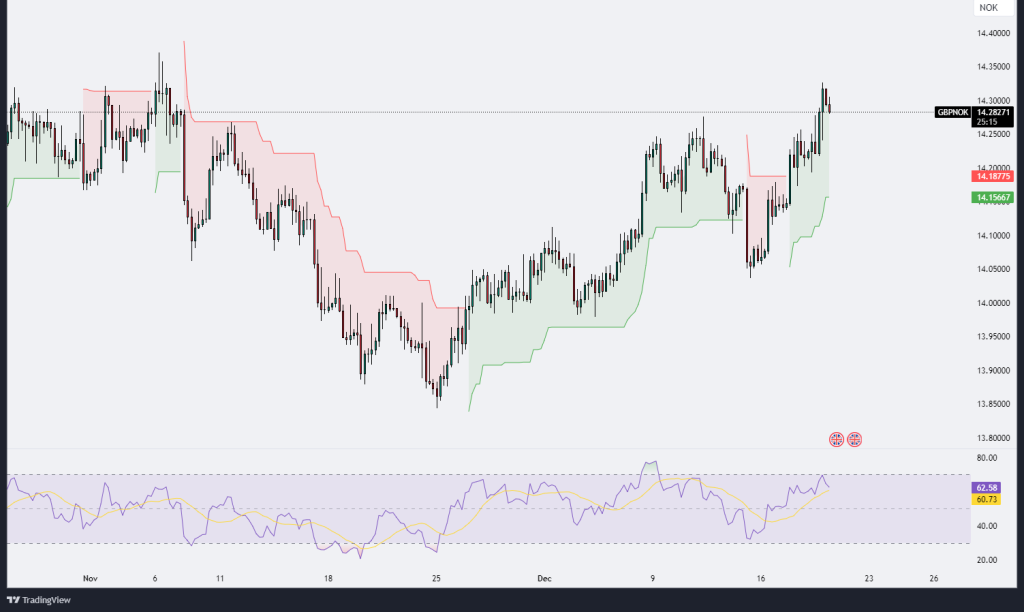
The GBPNOK chart illustrates a bullish momentum as the price climbs to 14.28314, marking a strong recovery from previous lower levels. This upward move has breached the upper boundary of the Ichimoku Cloud, which has shifted to green, signaling bullish dominance in the current trend. The Ichimoku setup now provides dynamic support around the 14.15–14.18 range, indicating potential levels for pullbacks or consolidation.
The price action showcases higher highs and higher lows, reinforcing the strength of the bullish trend. However, after touching a recent peak, there appears to be a slight rejection near the 14.30 level, which might act as a short-term resistance. This could suggest a minor retracement before another attempt to breach this level.
The Relative Strength Index (RSI) stands at 62.66, reflecting bullish momentum but approaching overbought territory. This indicates that while the upward momentum remains intact, the market might face resistance or require consolidation before continuing its rally. Traders should monitor the RSI for signs of divergence, as it could hint at a potential reversal or correction.
Volume trends appear steady, but any significant spike during pullbacks or at key resistance levels could provide further insight into market sentiment. If the pair sustains above 14.18, it may pave the way for further gains, targeting levels beyond 14.30. Conversely, a drop below the cloud support could signal the start of a deeper correction toward 14.00 or lower.
Overall, GBPNOK remains in a strong uptrend, supported by bullish indicators and favorable price action. However, traders should watch for signs of exhaustion near resistance and be prepared for potential pullbacks, which could offer new buying opportunities if the broader trend remains intact.
EURSEK
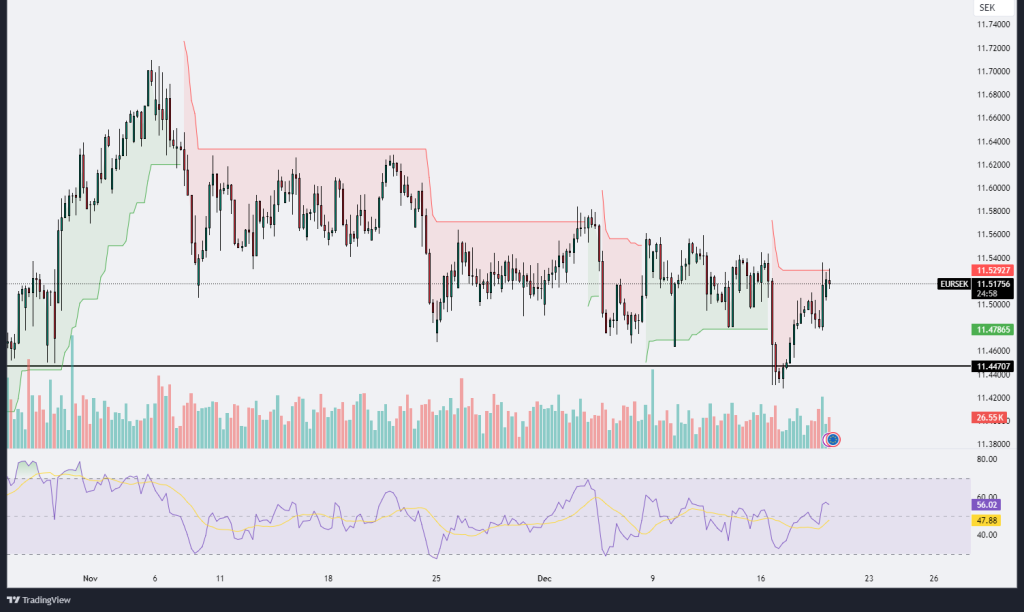
The EURSEK chart reveals a period of consolidation within a defined range, with the price currently trading around 11.51757, slightly below the resistance level at 11.52927. The price action indicates a short-term recovery from the support zone near 11.44707, which has acted as a critical demand area. This recent upward move suggests buying interest at lower levels, as confirmed by the rebound from the Ichimoku cloud’s lower boundary.
The Ichimoku indicator depicts a mixed scenario. While the price has moved slightly above the green cloud, hinting at short-term bullishness, the cloud itself remains relatively flat, suggesting a lack of strong directional momentum. This aligns with the overall sideways trend visible in the chart, with key levels at 11.52927 and 11.44707 acting as resistance and support, respectively.
The Relative Strength Index (RSI) is currently at 56.03, signaling neutral to mild bullish momentum. However, it is not in overbought territory, which implies that the price could attempt to test the resistance at 11.52927 again. A breakout above this level might lead to further bullish momentum, potentially targeting higher levels around 11.6000. Conversely, failure to breach this resistance could result in another retracement toward the 11.47865–11.44707 range.
Volume analysis shows a recent spike, indicating heightened market activity, possibly driven by the bounce from the support zone. However, sustained volume will be necessary to confirm any breakout above the resistance or a decisive move in either direction.
In summary, the EURSEK pair is currently in a consolidation phase, with traders likely watching for a breakout above 11.52927 or a breakdown below 11.44707 for directional cues. The broader trend remains neutral, with short-term bullish attempts needing stronger confirmation to establish a sustained trend.
.png)

.png)


